
U.S. Manufacturing PMI Hits 55.5% in October, Tenth Month of Growth – News and Statistics


Nov 3, 2026

U.S. manufacturing activity expanded for a tenth consecutive month in October, supported by faster production and steady growth in new factory orders, according to the Institute for Supply Management. The institute reported that its Manufacturing Purchasing Managers Index came in at 55.5 percent for the month, a gain of 1.0 percentage point from September.

The reading follows a ten-month contraction and, in the institute’s assessment, points to growth across the broader U.S. economy for a 24th straight month. Its economic modeling associates an October PMI of 55.5 percent with a 2.7 percent annualized rise in real gross domestic product.

Real GDP growth, year on year (quarterly), United States2.10% · Q3 2026 · ▼ 0.1 pp

201520202025

Source: U.S. Bureau of Economic Analysis

Susan Spence, chair of the institute’s Manufacturing Business Survey Committee, said manufacturing stayed in expansion territory during the month. She noted that four of the five subindexes making up the PMI grew faster than in September, while employment growth slowed by 0.3 percentage point.

The Production Index rose 2.3 percentage points to 59.0 percent from 56.7 percent in September, the highest level since November 2021 and a 12th consecutive month of expansion. The New Orders Index reached 55.5 percent, up 0.2 percentage point from September, for a tenth month of growth. The Backlog of Orders Index slipped 1.8 percentage points to 54.6 percent but remained in expansion for a tenth month.

Survey respondents in high-tech and defense markets described strong demand alongside severe lead-time pressure. One machinery-sector executive reported rapid growth in semiconductor and government and defense work, with lead times and prices climbing and some delays reminiscent of the Covid-19 period. A manager in miscellaneous manufacturing said commodities used by data centers remain constrained in both supply and pricing.

Demand for capital goods outside those areas showed hesitation. A computer and electronic products executive cited uncertainty in the Middle East, Eastern Europe and China, along with questions over research funding, as factors shaping customer purchasing behavior.

Employment expanded for a fourth consecutive month, though at a slightly slower pace. The Employment Index registered 52.4 percent, down 0.3 percentage point from September, and respondents favored hiring over reducing headcount by a ratio of 1.8 to 1. Eight industries reported employment growth, including four of the six largest sectors.

Raw materials inventories returned to expansion after contracting in September. The Inventories Index rose 2.8 percentage points to 51.4 percent, with seven industries expanding inventories.

Cost pressures remained a concern even as price inflation decelerated. The Prices Index registered 75.2 percent, down 2.7 percentage points from September, while still indicating a 25th consecutive month of higher raw material prices. Spence attributed the reading to higher steel and aluminum prices, tariffs on many imported goods, and rising petroleum-based products tied to the Middle East conflict.

Aluminum3,283 USD/mt · Sep 2026 · ▲ 1.0%

20222023202420252026

Source: World Bank Commodity Price Data (Pink Sheet) · CC BY 4.0

Supply chain bottlenecks worsened slightly. The Supplier Deliveries Index edged up 0.1 percentage point to 59.1 percent, marking an 11th consecutive month of slower delivery performance, with five of the six largest manufacturing industries reporting delays.

Respondents said tariffs and trade policies continued to complicate planning. A primary metals respondent cited material shortages, high fuel costs and persistent uncertainty, and said Canadian tariffs continue to hurt steel. A fabricated metal products executive said policies from Washington weigh on business conditions and that Canadian tariffs damage small U.S. businesses selling into that market.

The institute also reported that 6 percent of manufacturing GDP contracted in October, up from 2 percent in September, and that the share of sector GDP in strong contraction rose to 6 percent from 2 percent. Spence described the share of sector GDP at or below 45 percent as a useful gauge of overall manufacturing weakness.

  1. 1. INTRODUCTION

    Making Data-Driven Decisions to Grow Your Business

    1. REPORT DESCRIPTION
    2. RESEARCH METHODOLOGY AND THE AI PLATFORM
    3. DATA-DRIVEN DECISIONS FOR YOUR BUSINESS
    4. GLOSSARY AND SPECIFIC TERMS
  2. 2. EXECUTIVE SUMMARY

    A Quick Overview of Market Performance

    1. KEY FINDINGS
    2. MARKET TRENDS This Chapter is Available Only for the Professional EditionPRO
  3. 3. MARKET OVERVIEW

    Understanding the Current State of The Market and its Prospects

    1. MARKET SIZE: HISTORICAL DATA (2012–2025) AND FORECAST (2026–2035)
    2. CONSUMPTION BY COUNTRY: HISTORICAL DATA (2012–2025) AND FORECAST (2026–2035)
    3. MARKET FORECAST TO 2035
  4. 4. MOST PROMISING PRODUCTS FOR DIVERSIFICATION

    Finding New Products to Diversify Your Business

    1. TOP PRODUCTS TO DIVERSIFY YOUR BUSINESS
    2. BEST-SELLING PRODUCTS
    3. MOST CONSUMED PRODUCTS
    4. MOST TRADED PRODUCTS
    5. MOST PROFITABLE PRODUCTS FOR EXPORT
  5. 5. MOST PROMISING SUPPLYING COUNTRIES

    Choosing the Best Countries to Establish Your Sustainable Supply Chain

    1. TOP COUNTRIES TO SOURCE YOUR PRODUCT
    2. TOP PRODUCING COUNTRIES
    3. TOP EXPORTING COUNTRIES
    4. LOW-COST EXPORTING COUNTRIES
  6. 6. MOST PROMISING OVERSEAS MARKETS

    Choosing the Best Countries to Boost Your Export

    1. TOP OVERSEAS MARKETS FOR EXPORTING YOUR PRODUCT
    2. TOP CONSUMING MARKETS
    3. UNSATURATED MARKETS
    4. TOP IMPORTING MARKETS
    5. MOST PROFITABLE MARKETS
  7. 7. PRODUCTION

    The Latest Trends and Insights into The Industry

    1. PRODUCTION VOLUME AND VALUE: HISTORICAL DATA (2012–2025) AND FORECAST (2026–2035)
    2. PRODUCTION BY COUNTRY: HISTORICAL DATA (2012–2025) AND FORECAST (2026–2035)
  8. 8. IMPORTS

    The Largest Import Supplying Countries

    1. IMPORTS: HISTORICAL DATA (2012–2025) AND FORECAST (2026–2035)
    2. IMPORTS BY COUNTRY: HISTORICAL DATA (2012–2025) AND FORECAST (2026–2035)
    3. IMPORT PRICES BY COUNTRY: HISTORICAL DATA (2012–2025) AND FORECAST (2026–2035)
  9. 9. EXPORTS

    The Largest Destinations for Exports

    1. EXPORTS: HISTORICAL DATA (2012–2025) AND FORECAST (2026–2035)
    2. EXPORTS BY COUNTRY: HISTORICAL DATA (2012–2025) AND FORECAST (2026–2035)
    3. EXPORT PRICES BY COUNTRY: HISTORICAL DATA (2012–2025) AND FORECAST (2026–2035)
  10. 10. PROFILES OF MAJOR PRODUCERS

    The Largest Producers on The Market and Their Profiles

  11. 11. COUNTRY PROFILES

    The Largest Markets And Their Profiles

    This Chapter is Available Only for the Professional Edition
    PRO

    1. 11.1

      United States

      • Market Size
      • Production
      • Imports
      • Exports
    2. 11.2

      China

      • Market Size
      • Production
      • Imports
      • Exports
    3. 11.3

      Japan

      • Market Size
      • Production
      • Imports
      • Exports
    4. 11.4

      Germany

      • Market Size
      • Production
      • Imports
      • Exports
    5. 11.5

      United Kingdom

      • Market Size
      • Production
      • Imports
      • Exports
    6. 11.6

      France

      • Market Size
      • Production
      • Imports
      • Exports
    7. 11.7

      Brazil

      • Market Size
      • Production
      • Imports
      • Exports
    8. 11.8

      Italy

      • Market Size
      • Production
      • Imports
      • Exports
    9. 11.9

      Russian Federation

      • Market Size
      • Production
      • Imports
      • Exports
    10. 11.10

      India

      • Market Size
      • Production
      • Imports
      • Exports
    11. 11.11

      Canada

      • Market Size
      • Production
      • Imports
      • Exports
    12. 11.12

      Australia

      • Market Size
      • Production
      • Imports
      • Exports
    13. 11.13

      Republic of Korea

      • Market Size
      • Production
      • Imports
      • Exports
    14. 11.14

      Spain

      • Market Size
      • Production
      • Imports
      • Exports
    15. 11.15

      Mexico

      • Market Size
      • Production
      • Imports
      • Exports
    16. 11.16

      Indonesia

      • Market Size
      • Production
      • Imports
      • Exports
    17. 11.17

      Netherlands

      • Market Size
      • Production
      • Imports
      • Exports
    18. 11.18

      Turkey

      • Market Size
      • Production
      • Imports
      • Exports
    19. 11.19

      Saudi Arabia

      • Market Size
      • Production
      • Imports
      • Exports
    20. 11.20

      Switzerland

      • Market Size
      • Production
      • Imports
      • Exports
    21. 11.21

      Sweden

      • Market Size
      • Production
      • Imports
      • Exports
    22. 11.22

      Nigeria

      • Market Size
      • Production
      • Imports
      • Exports
    23. 11.23

      Poland

      • Market Size
      • Production
      • Imports
      • Exports
    24. 11.24

      Belgium

      • Market Size
      • Production
      • Imports
      • Exports
    25. 11.25

      Argentina

      • Market Size
      • Production
      • Imports
      • Exports
    26. 11.26

      Norway

      • Market Size
      • Production
      • Imports
      • Exports
    27. 11.27

      Austria

      • Market Size
      • Production
      • Imports
      • Exports
    28. 11.28

      Thailand

      • Market Size
      • Production
      • Imports
      • Exports
    29. 11.29

      United Arab Emirates

      • Market Size
      • Production
      • Imports
      • Exports
    30. 11.30

      Colombia

      • Market Size
      • Production
      • Imports
      • Exports
    31. 11.31

      Denmark

      • Market Size
      • Production
      • Imports
      • Exports
    32. 11.32

      South Africa

      • Market Size
      • Production
      • Imports
      • Exports
    33. 11.33

      Malaysia

      • Market Size
      • Production
      • Imports
      • Exports
    34. 11.34

      Israel

      • Market Size
      • Production
      • Imports
      • Exports
    35. 11.35

      Singapore

      • Market Size
      • Production
      • Imports
      • Exports
    36. 11.36

      Egypt

      • Market Size
      • Production
      • Imports
      • Exports
    37. 11.37

      Philippines

      • Market Size
      • Production
      • Imports
      • Exports
    38. 11.38

      Finland

      • Market Size
      • Production
      • Imports
      • Exports
    39. 11.39

      Chile

      • Market Size
      • Production
      • Imports
      • Exports
    40. 11.40

      Ireland

      • Market Size
      • Production
      • Imports
      • Exports
    41. 11.41

      Pakistan

      • Market Size
      • Production
      • Imports
      • Exports
    42. 11.42

      Greece

      • Market Size
      • Production
      • Imports
      • Exports
    43. 11.43

      Portugal

      • Market Size
      • Production
      • Imports
      • Exports
    44. 11.44

      Kazakhstan

      • Market Size
      • Production
      • Imports
      • Exports
    45. 11.45

      Algeria

      • Market Size
      • Production
      • Imports
      • Exports
    46. 11.46

      Czech Republic

      • Market Size
      • Production
      • Imports
      • Exports
    47. 11.47

      Qatar

      • Market Size
      • Production
      • Imports
      • Exports
    48. 11.48

      Peru

      • Market Size
      • Production
      • Imports
      • Exports
    49. 11.49

      Romania

      • Market Size
      • Production
      • Imports
      • Exports
    50. 11.50

      Vietnam

      • Market Size
      • Production
      • Imports
      • Exports
  12. LIST OF TABLES

    1. Key Findings In 2025
    2. Market Volume, In Physical Terms: Historical Data (2012–2025) and Forecast (2026–2035)
    3. Market Value: Historical Data (2012–2025) and Forecast (2026–2035)
    4. Per Capita Consumption, by Country, 2022–2025
    5. Production, In Physical Terms, By Country: Historical Data (2012–2025) and Forecast (2026–2035)
    6. Imports, In Physical Terms, By Country: Historical Data (2012–2025) and Forecast (2026–2035)
    7. Imports, In Value Terms, By Country: Historical Data (2012–2025) and Forecast (2026–2035)
    8. Import Prices, By Country: Historical Data (2012–2025) and Forecast (2026–2035)
    9. Exports, In Physical Terms, By Country: Historical Data (2012–2025) and Forecast (2026–2035)
    10. Exports, In Value Terms, By Country: Historical Data (2012–2025) and Forecast (2026–2035)
    11. Export Prices, By Country: Historical Data (2012–2025) and Forecast (2026–2035)
  13. LIST OF FIGURES

    1. Market Volume, In Physical Terms: Historical Data (2012–2025) and Forecast (2026–2035)
    2. Market Value: Historical Data (2012–2025) and Forecast (2026–2035)

    3. Consumption, by Country, 2025
    4. Market Volume Forecast to 2035
    5. Market Value Forecast to 2035
    6. Market Size and Growth, By Product
    7. Average Per Capita Consumption, By Product
    8. Exports and Growth, By Product
    9. Export Prices and Growth, By Product
    10. Production Volume and Growth
    11. Exports and Growth
    12. Export Prices and Growth
    13. Market Size and Growth
    14. Per Capita Consumption
    15. Imports and Growth
    16. Import Prices
    17. Production, In Physical Terms: Historical Data (2012–2025) and Forecast (2026–2035)
    18. Production, In Value Terms: Historical Data (2012–2025) and Forecast (2026–2035)
    19. Production, by Country, 2025
    20. Production, In Physical Terms, by Country: Historical Data (2012–2025) and Forecast (2026–2035)
    21. Imports, In Physical Terms: Historical Data (2012–2025) and Forecast (2026–2035)
    22. Imports, In Value Terms: Historical Data (2012–2025) and Forecast (2026–2035)
    23. Imports, In Physical Terms, By Country, 2025
    24. Imports, In Physical Terms, By Country: Historical Data (2012–2025) and Forecast (2026–2035)
    25. Imports, In Value Terms, By Country: Historical Data (2012–2025) and Forecast (2026–2035)
    26. Import Prices, By Country: Historical Data (2012–2025) and Forecast (2026–2035)
    27. Exports, In Physical Terms: Historical Data (2012–2025) and Forecast (2026–2035)
    28. Exports, In Value Terms: Historical Data (2012–2025) and Forecast (2026–2035)
    29. Exports, In Physical Terms, By Country, 2025
    30. Exports, In Physical Terms, By Country: Historical Data (2012–2025) and Forecast (2026–2035)
    31. Exports, In Value Terms, By Country: Historical Data (2012–2025) and Forecast (2026–2035)
    32. Export Prices, By Country: Historical Data (2012–2025) and Forecast (2026–2035)

Free Training

Source link

Factory job growth hits 5-year peak as US manufacturing keeps growing in October


The American manufacturing sector grew in October, with strong demand driving factory hiring to levels not seen in over five years.

S&P Global and the Institute for Supply Management released reports Monday on the health of the U.S. manufacturing sector. Both reports draw on surveys of manufacturing executives.

ISM showed the manufacturing sector expanded in October for the 10th straight month, which followed a 10-month streak of contraction.

ISM’s monthly surveys are used to generate a purchasing managers’ index, or PMI. That headline index registered 55.5%, near its 12-month high and a percentage point above September.

A manufacturing PMI above 47.5% generally indicates an expansion of the overall economy, according to ISM.

All five subindexes that directly factor into the PMI were in expansion territory. Those are new orders, production, employment, supplier deliveries, and inventories.

ISM also said five of the six largest manufacturing industries expanded in October.

Meanwhile, the S&P Global manufacturing PMI registered a 54.9 in October.

S&P Global said manufacturing growth remained “comfortably above trend” in October, though it said its PMI softened a bit from September’s 52-month high of 55.9.

Chris Williamson, the chief business economist at S&P Global Market Intelligence, said in the report that the U.S. manufacturing sector is having its best growth spell since early 2022.

“However, growing pains are clearly evident, with factories struggling to meet strong demand, especially for AI-related goods and equipment, amid supply chain disruptions,” Williamson said. “Delivery delays, often linked to shipping and logistics issues, are more widespread than at any time since 2022.”

S&P Global said manufacturers responded to increasing backlogs by generating jobs at a pace not seen for five-and-a-half years.

The firm said production and new orders increased in October, though at slower rates.

And inflationary pressures intensified.

S&P Global said demand pressures have allowed producers to increasingly pass along their higher costs to customers.

“Such steep growth in factory gate prices will inevitably feed through to consumers in the coming months, keeping inflation well above the Fed’s target and adding to pressure on policymakers to raise interest rates further,” Williamson said.

Victoria Bloom, the chief economist for the National Association of Manufacturers, told The National News Desk that both the ISM and S&P Global reports showed “continued strength in manufacturing.”

Bloom said the ISM report showed growth accelerated, while the S&P Global report showed growth softened. She chalked that up to differences in who the two firms survey and how they weight different components.

But she said both reports broadly told a growth story in American manufacturing, despite cost pressures and an increasing concern of price volatility.

FILE - Employees work on the line at the Webasto Plymouth Plant on May 1, 2026, in Plymouth, Michigan. (Photo by Sarah Rice/Getty Images)

FILE – Employees work on the line at the Webasto Plymouth Plant on May 1, 2026, in Plymouth, Michigan. (Photo by Sarah Rice/Getty Images)

Bloom said the backlog struggles differ by manufacturing subsector, but she views those demand pressures as a positive sign for future production.

She said factories have seen consistently strong demand from their customers, and not just those supporting data center construction.

“We’re optimistic that we’ll continue to see that in the months to come,” Bloom said. “And we see investment has really picked up, and we saw that kind of begin in the middle of last year following the passage of the tax bill. … Purchases of machinery and equipment picked up, and we also saw in this recent Q3 GDP report that spending on structures picked up. That is something that had been lagging for several quarters.”

Bloom also said the manufacturing sector can sustain its job growth as long as the new orders keep coming in and if the factory bosses aren’t deterred by the “environment of uncertainty” in the economy.

“But I think a lot of manufacturers have kind of adjusted to that uncertainty, or at least recognized that new order growth is too strong now for them to not be able to hire new workers to keep up with that new demand,” she said.

Free Training

Source link

Key Companies, Capacity Growth and Demand Forecast


Precedence Research Precedence Research

The global solar cell market is gaining momentum from Suniva’s planned $835 million investment in a 4.5 GW U.S. manufacturing facility, Premier Energies’ expansion to 10.6 GW of solar cell capacity, and India’s accelerating solar deployment. Rising domestic manufacturing, TOPCon technology adoption, supply-chain localization, and growing demand for high-efficiency photovoltaic cells are reshaping competitive positioning, investment priorities, pricing trends, and long-term demand across global solar markets.

Ottawa, Oct. 21, 2026 (GLOBE NEWSWIRE) — According to Precedence Research, the global solar cell market was valued at USD 175.15 billion in 2025 and is projected to increase from USD 205.28 billion in 2026 to USD 837.99 billion by 2035, registering a compound annual growth rate (CAGR) of 16.95% from 2026 to 2035.

For samples, case studies and examples, fill out the form on the report page: https://www.precedenceresearch.com/sample/2339

The growth opportunity extends beyond solar cell sales. Manufacturers, project developers, utilities, engineering and procurement contractors, equipment suppliers, investors and energy-intensive businesses are reassessing sourcing strategies, production capacity, technology selection and long-term power procurement. At the same time, manufacturing overcapacity, pricing pressure, trade restrictions and supply-chain concentration are creating new challenges for companies seeking sustainable margins.

Recent developments illustrate this changing landscape. Oswal Pumps has announced plans for a 1.2-gigawatt (GW) TOPCon solar cell manufacturing facility in India, supported by a planned investment of approximately USD 48 million. Meanwhile, global solar manufacturers are diversifying into battery storage as pressure on conventional panel margins continues. These developments create commercial opportunities for companies supplying manufacturing equipment, materials, cell technologies, energy storage, project development and market intelligence.

How Large Is the Solar Cell Market and What Is Driving Demand?

Market indicator

Value

Global market size, 2025

USD 175.15 billion

Estimated market size, 2026

USD 205.28 billion

Forecast market size, 2035

USD 837.99 billion

Forecast CAGR, 2026–2035

16.95%

Asia Pacific market share, 2025

48%

Crystalline material segment share, 2025

87%

Utility-scale installation share, 2025

65%

Solar cell demand is supported by utility-scale power generation, commercial and industrial electricity procurement, residential rooftop installations, electrification and the need to diversify energy sources. Government incentives, renewable-energy targets and domestic manufacturing programmes are also encouraging investment in cell production and integrated photovoltaic supply chains.

However, market growth does not guarantee equivalent profitability for every manufacturer. Cell producers must manage selling prices, utilisation rates, production yields, technology transitions, financing costs and access to customers. Companies with efficient manufacturing, differentiated products, dependable delivery and strong customer relationships may be better positioned than producers competing primarily on price.

For commercial teams, these market dynamics create a clear need to identify which manufacturers are expanding capacity, which developers are progressing projects, which buyers are changing suppliers and where local-content requirements are influencing procurement.

Contact Precedence Research to discuss a customised intelligence requirement: sales@precedenceresearch.com

Which Solar Cell Technologies and Applications Offer the Strongest Opportunities?

Crystalline solar cells accounted for approximately 87% of market revenue in 2025, reflecting the established position of crystalline-silicon photovoltaic technology. Within the industry, manufacturers are advancing technologies such as TOPCon, heterojunction (HJT), interdigitated back contact (IBC) and other advanced cell architectures to improve conversion efficiency, power output and performance under different operating conditions.

TOPCon is attracting investment as manufacturers upgrade production lines and seek improved performance from commercially scalable technology. HJT and back-contact designs offer further opportunities where efficiency, premium product positioning and specific system requirements support their economics. Thin-film technologies, including cadmium telluride, remain relevant in selected applications and competitive niches.

By installation type, utility-scale projects represented approximately 65% of the solar cell market in 2025. Large solar parks can create substantial procurement requirements, while commercial and residential installations offer a more distributed customer base. The latter can be attractive to manufacturers and distributors seeking regional partnerships, rooftop-system channels and recurring demand from installers.

The commercial opportunity depends on more than technology selection. Buyers also evaluate cell efficiency, degradation, temperature performance, reliability, bankability, certification, delivery schedules and compatibility with module manufacturing processes. Suppliers that align their product portfolios with these requirements can improve their positioning in tenders and long-term supply agreements.

How Are Manufacturing Capacity and Investment Reshaping Competition?

Manufacturing expansion is becoming a strategic priority as countries seek to strengthen domestic supply chains and reduce dependence on imported solar components. India is a particularly important market because domestic-content requirements and renewable-energy deployment are encouraging investment across cells, modules and related equipment.

Oswal Pumps’ planned 1.2 GW TOPCon cell facility, with an announced investment of approximately USD 48 million and commercial production expected by April 2028, illustrates the shift toward backward integration. The company plans to use the output for its own solar module manufacturing, supporting supply security and reducing exposure to spot-market cell pricing.

The broader industry faces a more complicated capacity outlook. India’s cell manufacturing expansion is helping address import dependence, but a rapid increase in available production can also put pressure on utilisation and realised selling prices. Manufacturers must balance new capacity against demand visibility, technology competitiveness and expected customer offtake.

Globally, major companies including LONGi, JinkoSolar, Trina Solar, JA Solar, Tongwei, Canadian Solar and First Solar compete through manufacturing scale, technology development, regional expansion and supply-chain integration. Their competitive positions differ by technology, product type, geography and business model; a company’s overall revenue or module shipment ranking should not automatically be interpreted as its share of the solar cell market.

China’s large manufacturing ecosystem remains central to global supply, while India, the United States and European markets are seeking to strengthen local production. Policy changes and proposed restrictions on selected solar-manufacturing technologies may affect equipment sourcing, technology licensing and the pace of new factory projects. Investors and suppliers therefore need to assess not only announced capacity, but also commissioning schedules, production readiness, customer commitments and policy exposure.

What Is Happening to Solar Cell Pricing and Profitability?

Pricing remains one of the most important variables in solar cell investment decisions. Global manufacturing scale and intense competition have reduced costs across much of the photovoltaic supply chain, but oversupply can also push selling prices below sustainable production economics. At the same time, trade measures, domestic-content requirements, shipping costs and local supply constraints can create regional price differences.

In India, cell sourcing requirements are changing procurement strategies. Industry estimates published in 2026 indicated that domestic cell capacity was expanding rapidly, while the timing of new supply and implementation of local-content rules could affect project costs. A shortage of eligible cells can raise procurement prices even when global supply remains ample. Conversely, substantial new capacity coming online may increase price competition and extend payback periods for newer facilities.

Manufacturers should therefore monitor several indicators together:

  • Cell and module spot prices, contract pricing and price premiums for high-efficiency products.

  • Polysilicon, wafer, silver and other input costs, along with energy and labour expenses.

  • Production yield, utilisation, warranty exposure and cost per watt.

  • Import duties, trade investigations, local-content requirements and product eligibility lists.

  • Inventory levels, customer commitments and the risk of technology becoming commercially uncompetitive.

For buyers, a lower quoted price is not necessarily the lowest lifecycle cost. Efficiency, degradation, warranty coverage, supplier financial stability, certification and delivery certainty can affect project economics. For manufacturers, reliable pricing intelligence can support negotiations, product positioning and decisions about where to allocate production.

Which Companies Are Leading and How Can Their Market Positions Be Compared?

The competitive landscape includes large-scale crystalline-silicon manufacturers, thin-film specialists, vertically integrated energy businesses and emerging technology providers. Relevant companies include:

Company

Competitive focus

LONGi Green Energy

Crystalline-silicon products and advanced cell technologies

JinkoSolar

High-volume cell and module manufacturing

Trina Solar

Integrated photovoltaic products and large-scale supply

JA Solar

Cell and module manufacturing with global distribution

Tongwei

Upstream silicon and solar cell production

Canadian Solar

Cell and module supply, alongside project and energy-storage businesses

First Solar

Thin-film photovoltaic technology

Hanwha Solutions / Qcells

Integrated solar manufacturing and regional market participation

Astronergy

Crystalline-silicon cell and module manufacturing

Risen Energy

Solar cells, modules and related energy solutions

Waaree Energies

Solar manufacturing and project-linked market opportunities

Premier Energies

Solar cell and module manufacturing in India

Adani Solar

Integrated domestic solar manufacturing

Vikram Solar

Solar modules and manufacturing expansion

Company market share should be evaluated using a consistent measure: solar cell revenue, cell production, annual cell capacity, shipments or a defined regional market. These metrics are not interchangeable. A company may have substantial nameplate capacity but lower actual output, or a strong module position without holding the same position in cell manufacturing.

A meaningful competitive assessment compares production capacity and utilisation, technology mix, conversion efficiency, customer concentration, export exposure, investment commitments, pricing power, regional access and the pace of new product launches. It also distinguishes operational facilities from announced or under-construction projects.

For business development teams, this information can identify suppliers seeking new customers, manufacturers entering new regions, competitors preparing capacity additions, equipment companies pursuing factory contracts and investors evaluating potential acquisition or partnership targets.

Related Reports

Where Are the Main Regional Opportunities?

Asia Pacific led the solar cell market with approximately 48% of global revenue in 2025. The region benefits from extensive manufacturing capacity, established component supply chains and strong deployment demand. China remains a major force in production, while India is expanding domestic cell manufacturing and project deployment. Japan and South Korea also contribute through technology, manufacturing and renewable-energy investment.

North America offers opportunities connected with domestic manufacturing, utility-scale development, commercial procurement and supply-chain diversification. Buyers and manufacturers must account for changing incentives, trade rules, project economics and local sourcing requirements.

Europe is focused on energy security, decarbonisation and the resilience of its clean-technology supply chain. Manufacturers may find opportunities in specialised production, equipment, technology partnerships and differentiated products, although factory economics and competition from imported supply remain important considerations.

Latin America benefits from solar resource availability and demand for additional electricity generation, creating opportunities for cell and module suppliers, distributors and project developers.

The Middle East and Africa offer opportunities in utility-scale solar, energy diversification and projects combining renewable generation with storage. Market entry depends on financing, grid access, local partnerships, procurement requirements and project execution capability.

How Can Solar Cell Market Intelligence Generate Qualified Business Leads?

The solar cell value chain creates multiple lead-generation opportunities. Rather than targeting companies solely by industry, commercial teams can prioritise accounts based on capacity expansion, procurement activity, technology transitions, new project announcements and regional market entry.

Target account group

Relevant decision-makers

Potential commercial opportunity

Solar cell and module manufacturers

CEO, COO, plant head, procurement director

Materials, equipment, technology partnerships and expansion intelligence

Solar project developers and IPPs

Project director, sourcing head, development lead

Supplier identification, project pipeline intelligence and cell procurement

EPC contractors and system integrators

Procurement manager, engineering head, business development director

Qualified supplier partnerships and tender opportunities

Utilities and energy companies

Renewable-energy head, generation planning lead

Capacity planning, project intelligence and technology evaluation

Raw-material and equipment suppliers

Sales director, key-account manager, strategy lead

Factory expansion tracking and account-based prospecting

Investors and infrastructure funds

Investment director, principal, corporate development lead

Company benchmarking, market entry and investment screening

Commercial and industrial energy buyers

Energy procurement head, sustainability director

Solar sourcing, supplier comparisons and project feasibility intelligence

The strongest lead signals include newly announced factories, capacity upgrades, tenders, long-term supply agreements, local-content mandates, technology transitions, acquisitions and expansion into new countries. Combining these signals with company-level intelligence helps sales teams distinguish immediate prospects from accounts with only general interest in solar energy.

Precedence Research can support these activities through market sizing, segment and regional analysis, company profiling, competitive benchmarking, demand forecasting and customised research. Its Master Dataset, Precedence Quadrant, Interactive Intelligence Dashboard and tailored consulting can help teams structure target-account lists, compare competitors, identify potential buyers and assess opportunities across the value chain. Research can be scoped for monthly, quarterly, six-monthly or annual updates, depending on the decision and market volatility.

What Should Companies Monitor Through 2035?

The solar cell market’s forecast growth creates substantial opportunities, but investment outcomes will depend on execution. Manufacturers must align capacity with realistic demand, manage input costs and maintain technology competitiveness. Buyers must assess supplier reliability and lifecycle performance, while investors need to distinguish announced capacity from commercially productive assets.

The most important indicators to monitor include new manufacturing commitments, actual output, cell and module pricing, utilisation rates, efficiency improvements, trade policy, project pipelines and long-term procurement agreements. Companies that combine these indicators with clear account targeting and competitive analysis can make better-informed decisions on sourcing, investment and market expansion.

Precedence Research’s solar cell market study provides a starting point for evaluating market growth, segment opportunities, regional demand and the competitive landscape. For organisations seeking to turn market developments into actionable sales pipelines or investment decisions, customised research can focus on specific technologies, companies, countries, customers and commercial questions.

Explore the report: https://www.precedenceresearch.com/solar-cell-market

About Precedence Research

Precedence Research provides market intelligence, competitive analysis, industry forecasts, company profiling and customised research for organisations evaluating growth opportunities across global markets. Its services support strategic planning, market entry, customer intelligence, competitive positioning, investment assessment and go-to-market decisions.

Schedule a meeting: https://www.precedenceresearch.com/schedule-meeting

Connect With Us

Email: sales@precedenceresearch.com
USA: +1 804 441 9344
APAC: +61 485 981 310
India: +91 87933 22019
Singapore: +65 3105 1271
Europe: +44 7383 092 044

LinkedIn: https://www.linkedin.com/company/precedence-research
Facebook: https://www.facebook.com/precedenceresearch
X: https://x.com/precedence_r
Medium: https://precedence-research.medium.com/

Partner Platforms

Towards Healthcare: https://www.towardshealthcare.com/
Towards Packaging: https://www.towardspackaging.com/
Towards Chemical & Materials: https://www.towardschemandmaterials.com/

Free Training

Source link

Hyundai Steel Celebrates Louisiana EAF Steel Mill Project Launch, Driving Growth for U.S. Manufacturing | Prnewswire


State

AlabamaAlaskaArizonaArkansasCaliforniaColoradoConnecticutDelawareFloridaGeorgiaHawaiiIdahoIllinoisIndianaIowaKansasKentuckyLouisianaMaineMarylandMassachusettsMichiganMinnesotaMississippiMissouriMontanaNebraskaNevadaNew HampshireNew JerseyNew MexicoNew YorkNorth CarolinaNorth DakotaOhioOklahomaOregonPennsylvaniaRhode IslandSouth CarolinaSouth DakotaTennesseeTexasUtahVermontVirginiaWashingtonWashington D.C.West VirginiaWisconsinWyomingPuerto RicoUS Virgin IslandsArmed Forces AmericasArmed Forces PacificArmed Forces EuropeNorthern Mariana IslandsMarshall IslandsAmerican SamoaFederated States of MicronesiaGuamPalauAlberta, CanadaBritish Columbia, CanadaManitoba, CanadaNew Brunswick, CanadaNewfoundland, CanadaNova Scotia, CanadaNorthwest Territories, CanadaNunavut, CanadaOntario, CanadaPrince Edward Island, CanadaQuebec, CanadaSaskatchewan, CanadaYukon Territory, Canada

Zip Code

Country

United States of AmericaUS Virgin IslandsUnited States Minor Outlying IslandsCanadaMexico, United Mexican StatesBahamas, Commonwealth of theCuba, Republic ofDominican RepublicHaiti, Republic ofJamaicaAfghanistanAlbania, People’s Socialist Republic ofAlgeria, People’s Democratic Republic ofAmerican SamoaAndorra, Principality ofAngola, Republic ofAnguillaAntarctica (the territory South of 60 deg S)Antigua and BarbudaArgentina, Argentine RepublicArmeniaArubaAustralia, Commonwealth ofAustria, Republic ofAzerbaijan, Republic ofBahrain, Kingdom ofBangladesh, People’s Republic ofBarbadosBelarusBelgium, Kingdom ofBelizeBenin, People’s Republic ofBermudaBhutan, Kingdom ofBolivia, Republic ofBosnia and HerzegovinaBotswana, Republic ofBouvet Island (Bouvetoya)Brazil, Federative Republic ofBritish Indian Ocean Territory (Chagos Archipelago)British Virgin IslandsBrunei DarussalamBulgaria, People’s Republic ofBurkina FasoBurundi, Republic ofCambodia, Kingdom ofCameroon, United Republic ofCape Verde, Republic ofCayman IslandsCentral African RepublicChad, Republic ofChile, Republic ofChina, People’s Republic ofChristmas IslandCocos (Keeling) IslandsColombia, Republic ofComoros, Union of theCongo, Democratic Republic ofCongo, People’s Republic ofCook IslandsCosta Rica, Republic ofCote D’Ivoire, Ivory Coast, Republic of theCyprus, Republic ofCzech RepublicDenmark, Kingdom ofDjibouti, Republic ofDominica, Commonwealth ofEcuador, Republic ofEgypt, Arab Republic ofEl Salvador, Republic ofEquatorial Guinea, Republic ofEritreaEstoniaEthiopiaFaeroe IslandsFalkland Islands (Malvinas)Fiji, Republic of the Fiji IslandsFinland, Republic ofFrance, French RepublicFrench GuianaFrench PolynesiaFrench Southern TerritoriesGabon, Gabonese RepublicGambia, Republic of theGeorgiaGermanyGhana, Republic ofGibraltarGreece, Hellenic RepublicGreenlandGrenadaGuadaloupeGuamGuatemala, Republic ofGuinea, Revolutionary
People’s Rep’c ofGuinea-Bissau, Republic ofGuyana, Republic ofHeard and McDonald IslandsHoly See (Vatican City State)Honduras, Republic ofHong Kong, Special Administrative Region of ChinaHrvatska (Croatia)Hungary, Hungarian People’s RepublicIceland, Republic ofIndia, Republic ofIndonesia, Republic ofIran, Islamic Republic ofIraq, Republic ofIrelandIsrael, State ofItaly, Italian RepublicJapanJordan, Hashemite Kingdom ofKazakhstan, Republic ofKenya, Republic ofKiribati, Republic ofKorea, Democratic People’s Republic ofKorea, Republic ofKuwait, State ofKyrgyz RepublicLao People’s Democratic RepublicLatviaLebanon, Lebanese RepublicLesotho, Kingdom ofLiberia, Republic ofLibyan Arab JamahiriyaLiechtenstein, Principality ofLithuaniaLuxembourg, Grand Duchy ofMacao, Special Administrative Region of ChinaMacedonia, the former Yugoslav Republic ofMadagascar, Republic ofMalawi, Republic ofMalaysiaMaldives, Republic ofMali, Republic ofMalta, Republic ofMarshall IslandsMartiniqueMauritania, Islamic Republic ofMauritiusMayotteMicronesia, Federated States ofMoldova, Republic ofMonaco, Principality ofMongolia, Mongolian People’s RepublicMontserratMorocco, Kingdom ofMozambique, People’s Republic ofMyanmarNamibiaNauru, Republic ofNepal, Kingdom ofNetherlands AntillesNetherlands, Kingdom of theNew CaledoniaNew ZealandNicaragua, Republic ofNiger, Republic of theNigeria, Federal Republic ofNiue, Republic ofNorfolk IslandNorthern Mariana IslandsNorway, Kingdom ofOman, Sultanate ofPakistan, Islamic Republic ofPalauPalestinian Territory, OccupiedPanama, Republic ofPapua New GuineaParaguay, Republic ofPeru, Republic ofPhilippines, Republic of thePitcairn IslandPoland, Polish People’s RepublicPortugal, Portuguese RepublicPuerto RicoQatar, State ofReunionRomania, Socialist Republic ofRussian FederationRwanda, Rwandese RepublicSamoa, Independent State ofSan Marino, Republic ofSao Tome and Principe, Democratic Republic ofSaudi Arabia, Kingdom ofSenegal, Republic ofSerbia and MontenegroSeychelles, Republic ofSierra Leone, Republic ofSingapore, Republic ofSlovakia (Slovak Republic)SloveniaSolomon IslandsSomalia, Somali RepublicSouth Africa, Republic ofSouth Georgia and the South Sandwich IslandsSpain, Spanish StateSri Lanka, Democratic Socialist Republic ofSt. HelenaSt. Kitts and NevisSt. LuciaSt. Pierre and MiquelonSt. Vincent and the GrenadinesSudan, Democratic Republic of theSuriname, Republic ofSvalbard & Jan Mayen IslandsSwaziland, Kingdom ofSweden, Kingdom ofSwitzerland, Swiss ConfederationSyrian Arab RepublicTaiwan, Province of ChinaTajikistanTanzania, United Republic ofThailand, Kingdom ofTimor-Leste, Democratic Republic ofTogo, Togolese RepublicTokelau (Tokelau Islands)Tonga, Kingdom ofTrinidad and Tobago, Republic ofTunisia, Republic ofTurkey, Republic ofTurkmenistanTurks and Caicos IslandsTuvaluUganda, Republic ofUkraineUnited Arab EmiratesUnited Kingdom of Great Britain & N. IrelandUruguay, Eastern Republic ofUzbekistanVanuatuVenezuela, Bolivarian Republic ofViet Nam, Socialist Republic ofWallis and Futuna IslandsWestern SaharaYemenZambia, Republic ofZimbabwe

Free Training

Source link

Hyundai Steel Celebrates Louisiana EAF Steel Mill Project Launch, Driving Growth for U.S. Manufacturing


  • $5.8 billion investment part of Hyundai Motor Group’s $26 billion U.S. commitment, strengthening local supply chain and industrial resilience
  • Commercial production to begin in 2029 with 2.7 million metric tons annual capacity, supporting 5,400 jobs including 1,300 direct employments
  • First Electric Arc Furnace-based integrated steel mill in the U.S., leveraging advanced technologies including Direct Reduction Process
  • Supplying high-quality, low-carbon emissions steel to global automakers including Hyundai Motor and Kia

SEOUL, South Korea and ASCENSION PARISH, La., Sept. 5, 2026 /PRNewswire/ — Hyundai Steel Company held a ceremonial event today for a $5.8 billion Electric Arc Furnace-based integrated steel mill in Louisiana, the first of its kind in North America, marking a pivotal moment in strengthening U.S. manufacturing resurgence.

(From left) Gang Hyun Seo, Hyundai Motor Group President; Kwang-moo Kim, Senior Executive Vice President; Leroy Sullivan, Mayor of Donalsonville; José Muñoz, President and CEO of Hyundai Motor Company; Susan Bourgeois, Louisiana Economic Development Secretary; Julia Letlow, U.S. Representative; Kyung-wha Kang, South Korean Ambassador to the U.S.; In-hwa Chang, POSCO Group Chairman; Jeff Landry, Louisiana Governor; Euisun Chung, Hyundai Motor Group Executive Chair; Troy Carter, U.S. Representative; Jung-kwan Kim, Korea’s Minister of Trade, Industry and Resources; William Kimmitt, U.S. Under Secretary of Commerce for International Trade; Bo-Ryong Lee, President and CEO of Hyundai Steel; Clint Cointment, Ascension Parish President; Ho Sung Song, President and CEO of Kia Corporation; Sung Kim, Hyundai Motor Group President; Cortaz Johnson, Student of River Parishes Community College (RPCC)

Under the slogan of “Building the Future of Steel, Together with Louisiana,” the ceremonial event took place at the RiverPlex MegaPark in Ascension Parish, Louisiana. The new mill will be operated by HYUNDAI-POSCO Louisiana Steel LLC (HPLS), a joint venture between Hyundai Steel, POSCO, Hyundai Motor Company and Kia Corporation.

The $5.8 billion investment establishes the first North American steel production base for Hyundai Steel, Hyundai Motor Group’s steelmaking arm. With commercial production targeted for 2029, the mill will have an annual capacity of 2.7 million metric tons of hot-rolled and cold-rolled steel sheets, primarily for automotive applications, and is expected to create 5,400 jobs, including 1,300 direct positions.

“As America strengthens its manufacturing leadership, steel will continue to power the next chapter of its industrial resurgence,” said Hyundai Motor Group Executive Chair Euisun Chung. “We are proud to contribute to that vision and to the future of ‘Made in America’. Together, we will turn our shared ambitions into greater productivity and prosperity.”

Advancing Hyundai Motor Group’s Commitment to U.S. Manufacturing

The Louisiana steel mill is a cornerstone of Hyundai Motor Group’s $26 billion U.S. investment commitment through 2028, announced in 2025. This strategic initiative represents Hyundai Motor Group’s significant expansion in the U.S. spanning automotive production, advanced steelmaking, robotics innovation, and other key sectors—establishing a fully integrated ecosystem expanding the U.S. manufacturing footprint and mobility value chain. Since entering the U.S. market in 1986, Hyundai Motor Group has invested more than $20.5 billion.

About Hyundai Steel

More information about Hyundai Steel, please see: https://hyundai-steel.com/en

About HYUNDAI-POSCO Louisiana Steel (HPLS)

More information about HPLS can be found at: https://www.linkedin.com/company/hyundai-posco-louisiana-steel/

About Hyundai Motor Group
More information about Hyundai Motor Group can be found at: http://www.hyundaimotorgroup.com or Newsroom: Media Hub by Hyundai, Kia Global Newsroom, Genesis Newsroom


This article was produced by Cision PR Newswire, our trusted news partner. The views expressed and the content presented here are solely those of the author and may not fully reflect the opinions of Thailand Business News.
Read the original article : Hyundai Steel Celebrates Louisiana EAF Steel Mill Project Launch, Driving Growth for U.S. Manufacturing

Free Training

Source link

Hyundai’s Growth Is Pushing Genesis’ US Production Back to Korea


Genesis, Hyundai Motor Group’s luxury brand, is putting its US manufacturing footprint temporarily on hold to make room for its parent company, Business Insider confirmed on Thursday.

Ted Mengiste, chief operating officer of Genesis Motor North America, said in an interview that Hyundai is moving production of the GV70 SUV — the brand’s best-selling model in the US — out of its Montgomery, Alabama, plant and back to Ulsan, South Korea.

The move would effectively consolidate Genesis vehicle production in Korea, where Hyundai has its largest manufacturing facility. The Ulsan complex already produces much of the Genesis lineup.

Mengiste attributed the decision to Hyundai’s growth in the US. Hyundai reported a record 450,568 vehicles sold in the US in the first half of 2026, up 3% from a year earlier, after setting a full-year sales record in 2025.

“Hyundai’s growing very rapidly in the United States, and our plant in Alabama produced Hyundais and Genesis,” he said. “But capacity became so tight for Hyundai that we took our GV70 production back to Ulsan to allow for incremental production capacity for Hyundai.”

The Seoul Economic Daily first reported the move in July, citing industry sources.

Inside Hyundai Motor Manufacturing Alabama

The Hyundai Motor Manufacturing Alabama facility first opened in 2005 and has an annual production capacity of nearly 400,000 vehicles. 

Luke Sharrett/Bloomberg via Getty Images

The move comes months after Genesis said expanding US production would be part of its next phase of North American growth. In April, the company announced plans for 22 new or “significantly enhanced” models through 2030 and tied the strategy to Hyundai’s multi-billion-dollar investment in the US.

Genesis said that its “growing US production footprint” and increased parts localization would help support sustained growth.

“These new models, advanced powertrains, and expanded production initiatives build on Hyundai Motor Group’s previously announced $26 billion investment in the United States,” the company said in a statement at the time.

Hyundai Motor Group has had a decadeslong investment in the American South and operates three vehicle assembly plants in Alabama and Georgia, with a total annual production capacity of roughly 1 million cars. The company plans to increase the figure to 1.2 million as it expands its new Georgia Metaplant.

Genesis represented a small slice of Hyundai’s Alabama output. The Business Alabama Magazine reported in March that the plant produced under 23,000 GV70 vehicles. The plant has a total capacity to build 400,000 vehicles annually.

Still, the GV70 is a crucial part of Genesis’ US business. The company sold 33,876 GV70s in 2025, helping Genesis set a sales record of more than 82,000 vehicles — a 10% year-over-year increase.

Hyundai Motor Company CEO José Muñoz said at a media roundtable on Thursday that the company’s basic manufacturing principle is to “produce where you sell.” However, he added that lower-volume vehicles can’t always justify multiple production locations.

Genesis’ new flagship model, the all-electric GV90 SUV, which was unveiled on Wednesday, will be produced in Korea. Munoz said the model won’t be produced in America “in the short term,” in part because the expected volume makes centralized production more practical.

Genesis expects the GV90 to reach US dealers in the first quarter of 2027.

Mengiste said during the interview that moving GV70 production back to Korea did not mark the end of Genesis’ US manufacturing footprint.

“We had to leave some room, but we’re coming back. And we’ve made that declaration,” he said.

Free Training

Source link

Nebraska Manufacturing Growth Slows as Regional Economy Continues to Expand


By Allison Peck

 The Tyson beef plant in Lexington, shown in December, 2026 closure accounted for 3,212 jobs. (Juan Salinas II/Nebraska Examiner) The Tyson beef plant in Lexington, shown in December, 2026 closure accounted for 3,212 jobs. (Juan Salinas II/Nebraska Examiner)

Manufacturing activity across the Mid-America region remained in growth territory for the sixth consecutive month in July, according to the latest Creighton University Mid-America Business Conditions Index. While the regional economy continues to show steady expansion, Nebraska recorded the weakest manufacturing performance among the nine states included in the monthly survey.

The overall Business Conditions Index slipped slightly to 55.7 in July from 56.0 in June. A reading above 50 indicates growth in the manufacturing sector.

Ernie Goss, director of Creighton University’s Economic Forecasting Group, said regional manufacturers continue to perform well despite persistent inflationary pressures.

“Regional manufacturing growth continues on a solid pace but with elevated inflationary pressures at the wholesale level,” Goss said.

Inflation remains a major concern for manufacturers. Although the wholesale price index declined from June, it stayed well above growth-neutral levels, leading researchers to conclude the Federal Reserve is unlikely to lower interest rates over the next several months.

Supply managers also reported continued effects from the war in Iran. Nearly two-thirds said the conflict has led to shipping delays and higher transportation costs, while more than 93 percent reported they have been able to pass those increased costs on to customers.

Employment across the region showed modest improvement, with the manufacturing employment index moving above growth-neutral for only the second time in the past year. About one in four companies reported adding workers during July, while only one in 13 reported layoffs.

Some manufacturers also reported signs that production is returning to the United States.

“It is encouraging to see reshoring taking place,” one supply manager said. “Two major customers have moved operations from Mexico to the U.S.”

In Nebraska, the Business Conditions Index fell to 51.1 in July from 52.5 in June, the lowest reading among the nine-state region. While the state’s manufacturing sector continued to expand slightly, its employment index dropped to 46.6, indicating continued job losses.

According to U.S. Bureau of Labor Statistics data cited in the report, Nebraska has lost approximately 4,700 manufacturing jobs over the past 12 months, a decline of 4.6 percent. The food processing industry accounted for about 4,000 of those lost jobs.

Despite Nebraska’s weaker performance, business leaders across the region remain cautiously optimistic. The six-month Business Confidence Index climbed to 57.7 in July, its highest level since January. However, Goss warned that continued geopolitical tensions, higher oil prices and supply disruptions could weaken confidence in the months ahead.

The Creighton University survey measures manufacturing activity in Arkansas, Iowa, Kansas, Minnesota, Missouri, Nebraska, North Dakota, Oklahoma and South Dakota and is considered a leading indicator of economic conditions across the Mid-America region.

Free Training

Source link

US manufacturing hits 4-year high, with AI buildout a major driver of growth, though price volatility looms: survey


Manufacturing activity in July hit a four-year high, with massive AI infrastructure investment a major driver of growth — even as industry leaders sounded the alarm over price volatility, according to a survey released Monday.

The Institute for Supply Management’s July manufacturing gauge jumped to 55.6 – expanding at its fastest pace since May 2022 and marking its seventh consecutive month of growth, the survey said.

President Trump has called for a return to US manufacturing. REUTERS

Any reading above 50 in the ISM’s monthly survey indicates growth while any measure below 50 signals contraction.

Susan Spence, chair of the ISM Manufacturing Business Survey Committee, said increased certainty around President Trump’s tariff policy and hopes for a more permanent deal to end the war in Iran helped encourage the boost in manufacturing.

“My gut is, it’s not just a one- or two-month trend,” Spence told reporters. “Companies are seeing six or more months of these solid demand factors going in the right direction.”

The survey’s gauge for production jumped to 58.5, its highest level since the end of 2021; the employment measure hit 52.8, rising for the first time in nearly three years; and new orders growth, which signals demand, also increased.

Massive business investments in AI infrastructure helped drive the expansion, along with political pressure to ramp up US manufacturing, according to experts.

Despite the growth in manufacturing, individuals’ responses to the ISM survey were overwhelmingly negative, with many industry leaders calling out price shocks from the Iran war and the chances that the Fed could raise interest rates next month to counter inflation fears.

“Pricing volatility was mentioned in 57% of negative comments, the Iran war 43%, increasing lead times 22% and tariffs 18%,” Spence said.

Among the survey responses, one metals producer remarked that “it makes me yearn for the coronavirus pandemic chaos, which was more manageable than whatever this is that we are in.”

The Institute for Supply Management’s July manufacturing gauge jumped to 55.6. AFP via Getty Images

Some transportation equipment manufacturers lamented increased costs and transit time “for rerouted shipments due to conflicts in the Red Sea, Strait of Hormuz and Suez Canal.”

Others noted that a spike in demand for certain electronics supplies due to the AI race was “challenging on-time fulfillment for our supply chains.”

Jackson Barnes, CEO of Novo, a financial platform for small businesses, said the build-out of massive AI data centers is largely driving manufacturing investments – but that has a lopsided impact on the industry. 

“Look at where the demand is coming from. It’s coming from semiconductors, AI infrastructure and defense. Those are capital-intensive supply chains dominated by large manufacturers,” Barnes told The Post.

Massive business investments in AI infrastructure helped drive the expansion, according to experts. Getty Images

“That gap shows up clearly in what we see. Across the small manufacturers we work with, the median firm’s quarterly revenue is down roughly 12% from two years ago, even though total volume across that same group is up about 14%.”

Tech giants like Meta and Microsoft have announced planned capital expenditures this year of as much as $145 billion and $190 billion, respectively, as they ramp up their AI efforts.

Rising oil prices amid the Iran war have multiplied costs for nearly every manufacturer – and the concern for many in the industry is that the Federal Reserve could soon raise interest rates as a result, which could hit their growth streak.

Overall, it was a strong report, according to experts, as all but one manufacturing industry reported growth in July — including electrical equipment, appliances and components and computer and electronic products. Chemical products marked the only sector that contracted over the month.

“I would say that a lot of the tech investment right now has a lag,” said Amrita Bhasin, co-founder and CEO of Sotira and a manufacturing expert. “There is a lot of money being poured into AI infrastructure and that infrastructure is very resource-intensive.”

“I am optimistic just because we’ve got a lot of factors that are all coinciding at the right time,” Bhasin told The Post.

Free Training

Source link

US Manufacturing Labor Productivity Growth Has Stagnated | Blogs | Jul 20, 2026


Manufacturing labor productivity growth is a key driver of the United States’ long-term economic performance and global competitiveness. Labor productivity measures how much output workers produce per hour. When it rises, firms can produce more goods with the same amount of labor, lowering unit labor costs and improving efficiency. This makes firms more competitive globally, supports higher wages over time, and strengthens the broader economy. Despite these benefits, data from the Bureau of Labor Statistics show that U.S. manufacturing productivity growth has slowed sharply since 2005. Congress should provide a 25 percent tax credit to firms adopting productivity-enhancing technologies, such as artificial intelligence systems and industrial robots. This would bolster overall manufacturing productivity growth and ensure that the United States remains competitive with its global rivals.

Labor productivity growth across industries drives a nation’s efficiency and competitiveness. When productivity growth is strong in all sectors, workers can produce more output per hour, allowing firms to scale production, reduce per-unit costs, and compete more effectively in global markets. Higher productivity also frees up resources for investment in research, capital equipment, and process innovation, reinforcing long-run technological leadership. Conversely, when productivity growth slows, unit labor costs rise relative to those of foreign competitors, weakening export competitiveness and limiting industrial expansion.

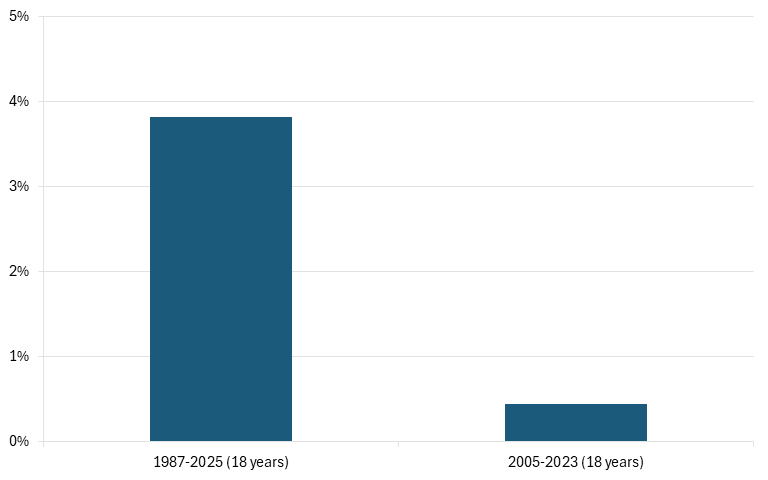
Despite its importance, U.S. manufacturing labor productivity growth has slowed dramatically in recent decades. From 1987 to 2005, manufacturing productivity grew at an average annual rate of 3.8 percent. However, from 2005 to 2023, its average annual growth rate fell to just 0.4 percent. (See figure 1.) This sustained decline points to a structural slowdown rather than merely a cyclical fluctuation, indicating a broad-based weakening in manufacturing productivity performance.

Figure 1:Manufacturing sector’s average annual growth rates

image

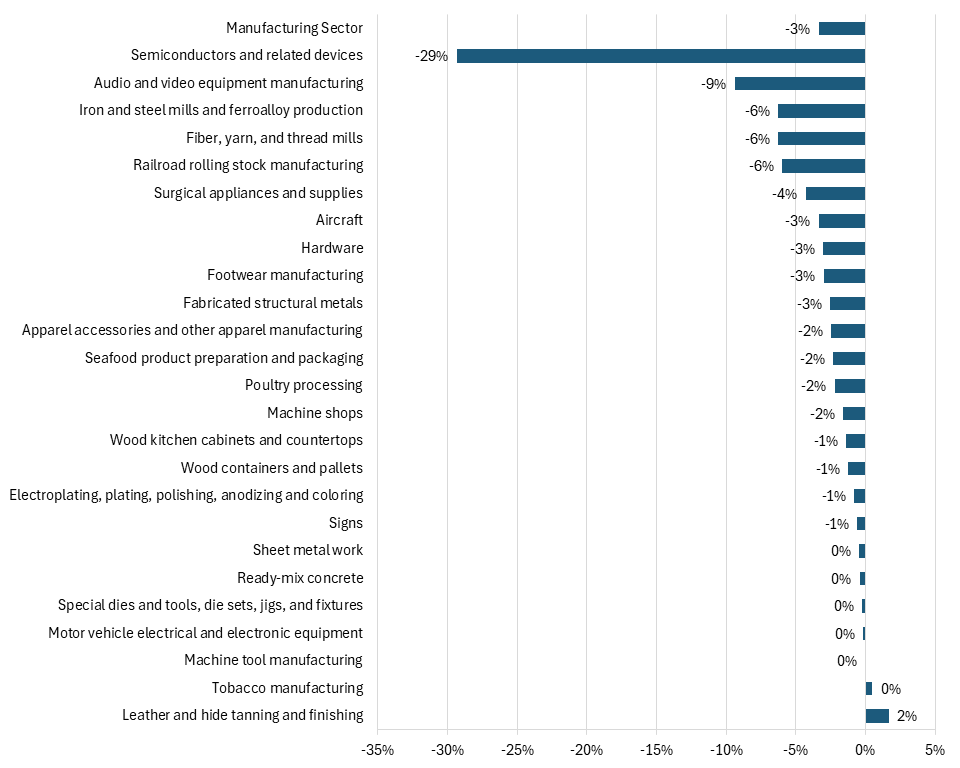
When disaggregated by industry, the data show that the slowdown remains widespread across the manufacturing sector. Of the 27 industries with available data, only 2 experienced higher productivity growth in the post-2005 period than from 1987 to 2005. Notably, both gains occurred in non-advanced industries: leather and hide tanning and finishing, where productivity growth rose by 1.7 percentage points, and tobacco manufacturing, where it increased by 0.5 percentage points.

In contrast, all advanced manufacturing industries for which data are available have experienced declines in productivity growth. For instance, annual productivity growth in computer and electronic product manufacturing fell from 1.9 percent from 1987 to 2005 to −1.2 percent from 2005 to 2023, a decline of roughly 3 percentage points. Aircraft manufacturing experienced a similar decline of about 3 percentage points during the same period. (See figure 2.)

Figure 2: Percentage point change in average annual growth rates from 1987-2005 period to 2005-2023 period, by manufacturing industries

image

This is particularly worrisome because China has significantly increased its production capacity in advanced industries and has already established leadership in many of them. As the latest edition of ITIF’s Hamilton Index highlights, China now dominates global production in advanced industries, accounting for nearly one-quarter of output across all 10 advanced industries combined and leading production in 7 of them. If U.S. productivity growth continues to stagnate in these sectors, the consequences will include not only slower economic growth but also a sustained loss of global market share in industries where leadership is difficult to regain once lost.

To reverse the slowdown in manufacturing productivity growth, Congress should establish a 25 percent tax credit for firms adopting productivity-enhancing technologies, including industrial robots, artificial intelligence systems, and advanced manufacturing software. By reducing the cost of technology adoption, the credit would encourage firms to modernize their production processes, increase output per worker, and strengthen their global competitiveness.

Free Training

Source link

SEIA Highlights U.S. Solar Manufacturing Growth and Energy Infrastructure Expansion


Highlights

  • U.S. solar and storage manufacturing capacity has expanded significantly since 2022.
  • More than 140 domestic manufacturing facilities have opened, with dozens more under construction.
  • Solar and battery storage projects are increasingly tied to military resilience and grid reliability initiatives.
  • Agrivoltaic developments are creating additional revenue opportunities for rural landowners and agricultural operators.
  • National solar installations surpassed 6 million during the first quarter of 2026.

Rising electricity demand, supply chain concerns, and domestic manufacturing priorities are continuing to shape investment decisions across the U.S. energy and construction sectors. The Solar Energy Industries Association recently outlined how solar generation and battery storage projects are contributing to infrastructure development, manufacturing expansion, and energy resilience initiatives nationwide.

The organization said domestic production capacity for solar components has increased rapidly over the last several years as developers, utilities, and manufacturers respond to growing demand for renewable energy infrastructure and federal incentives supporting U.S.-based production.

Domestic Manufacturing Expansion

According to SEIA, 146 solar and energy storage manufacturing facilities have opened in the United States since 2022, while another 36 facilities are currently under construction. Domestic solar module manufacturing capacity has reached approximately 70 gigawatts annually.

The organization said the U.S. solar supply chain can now support production across all major solar component categories, reflecting broader efforts to reduce dependence on imported materials and equipment.

For contractors, developers, and procurement teams, expanded domestic manufacturing capacity may help address supply chain volatility, material lead times, and sourcing requirements tied to federal infrastructure and energy programs.

The growth in manufacturing activity also continues to drive industrial construction demand tied to factory development, utility infrastructure upgrades, and logistics facilities supporting energy production.

Military and Rural Energy Projects

SEIA also pointed to increasing deployment of solar and storage systems at military facilities and rural properties.

Among the projects highlighted was a 13-megawatt solar installation being developed by Onyx Renewables to support U.S. Army housing operations. The project is expected to offset a substantial portion of on-base electricity demand. Duke Energy also completed a floating solar installation at Fort Bragg designed to improve energy resilience and reduce operating costs.

In rural markets, agrivoltaic projects are becoming more common as landowners seek additional revenue sources while maintaining agricultural operations. SEIA referenced a Tennessee project developed by Silicon Ranch that combines solar generation with cattle grazing operations on the same site.

Construction activity tied to agrivoltaics, utility-scale solar, and battery storage continues to create opportunities for civil contractors, electrical contractors, specialty trade firms, and site development teams across multiple regions.

Energy Infrastructure Demand Continues to Grow

SEIA reported that cumulative U.S. solar installations exceeded 6 million during the first quarter of 2026 as utilities, developers, and private owners continue investing in additional generation capacity.

The organization also noted that solar projects can often move through deployment timelines more quickly than conventional generation assets because they do not require fuel supply infrastructure.

What This Means For Construction Owners

For construction owners and developers, continued investment in renewable energy infrastructure is expected to sustain demand for transmission upgrades, energy storage facilities, utility interconnections, manufacturing plants, and associated site work.

The expansion of domestic solar manufacturing and generation capacity also reflects broader infrastructure investment trends tied to grid modernization, energy security, and industrial development across the United States.

Source: SEIA.

Free Training

Source link