Gelatys Opens New $8 Million Production Facility, Expanding U.S. Manufacturing Capacity and Fueling National Grocery Growth


The #1 Gelato Frozen Novelties Brand in the U.S. Scales Production to Accelerate National Expansion

MIAMI, May 27, 2026 /PRNewswire/ — Gelatys, the #1 gelato frozen novelties brand in the United States and the only manufacturer of frozen gelato novelties in America, announced the opening of a new, state-of-the-art production facility in Fort Myers, FL. With an $8 million investment, the new 30,000+ square-foot facility is operational, signifying a key step in the company’s growth into a national CPG brand.

Gelatys CEO, Adolfo Heller Cohen, in front of the new production facility in Fort Myers, FL

Gelatys CEO, Adolfo Heller Cohen, in front of the new production facility in Fort Myers, FL

Built on a 1.5-acre site, the Fort Myers facility investment represents more than a manufacturing expansion; it’s the operational foundation Gelatys is building to support national grocery growth, fuel differentiated frozen-novelty innovation, and solidify its position as the defining brand in a category it pioneered. The site features next-generation machinery capable of producing in one hour what previously required an entire day. It will scale production to support the national expansion of Mini Gems, Gelatys’ premium, portion-controlled gelato mini pops, and the next generation of premium Italian-style frozen novelty innovation.

“When my family and I moved to Miami, Gelatys began as a dream to bring true artisanal gelato to the U.S. market. We quickly saw a larger opportunity; premium gelato novelties were not being manufactured at scale because of how technically complex they are. That challenge became our innovation story, pushing us to create our own processes, adapt machinery, and build products that did not yet exist in the market,” said Adolfo Joel Heller Cohen, Founder & CEO, Gelatys. “Our new Fort Myers facility isn’t just an expansion, it’s the infrastructure we always knew this brand would need when growing from a local concept into a national brand. We’re the only manufacturer of its kind in the United States, and we built that from scratch. The ambition that started Gelatys hasn’t changed, and looking ahead, we’re just getting started.”

The new facility reflects the full scope of Gelatys’ growth trajectory. Since launching as a two-kiosk mall concept in Miami in 2016, the brand has expanded to 5,000+ locations across 26 states, with a retail footprint that includes Whole Foods Market, Sprouts, Wegmans, H-E-B, Kroger banners including Mariano’s, QFC, Fred Meyer and King Soopers, The Fresh Market, and more.

Besides its manufacturing significance, the Fort Myers facility is creating approximately 75 new jobs in the region, adding to the roughly 50 employees that supported Gelatys’ original Miami facility. This new operation is the production backbone of what Gelatys is building, an American-made frozen gelato novelties brand designed to scale.

For more information about Gelatys and Mini Gems, visit gelatys.com or follow @gelatysusa on Instagram.

Media Contact
Amy Tew
310-351-4332
[email protected]

SOURCE Gelatys


Free Training

Source link

USA Manufacturing Site Expansion – Abingdon Health plc


York, UK and Madison, WI, USA, 27 May 2026: Abingdon Health plc (AIM: ABDX) (OTCQB: ABDXF), a leading international developer, manufacturer and regulatory services provider for rapid diagnostic tests and med-tech, announces that its US subsidiary, Abingdon Health USA, Inc., has entered into a Business Development Tax Credit Agreement with the Wisconsin Economic Development Corporation (“WEDC”). WEDC serves as the state’s agency for economic development, fostering job growth and business expansion.

Under the agreement, Abingdon Health USA, Inc. has been certified as eligible to earn up to US$370,000 in performance-based Wisconsin tax credits over a three-year period commencing 1 January 2026. The credits comprise up to US$320,000 linked to the creation of new full-time roles and up to US$50,000 linked to qualifying capital investment at the Group’s facilities in Wisconsin over this period.  The amount of credits the Company will receive is contingent on the number of jobs created and amount of capital invested.

This award reflects the continued growth of the Group’s US operations and supports the ongoing expansion of its facilities in Madison, Wisconsin, which serve as Abingdon Health’s North American base for development, manufacturing and commercial activities.

John W. Miller, Secretary and CEO of WEDC, said “Abingdon’s decision to locate in Wisconsin and continue to grow here reflects the strength of our state’s leadership in the field of biohealth and biotechnology, our outstanding research institutions, and our highly trained workforce.  WEDC is proud to partner with Abingdon as they open this next chapter.”

Chris Yates, President of Abingdon Health USA Inc, said: “We are grateful for this award from the Wisconsin Economic Development Corporation, which serves as a welcome endorsement of our commitment and investment in Wisconsin and our positioning in the US market. These tax credits will support our expansion at University Research Park in Madison, including the creation of additional skilled roles as Abingdon Health USA continues to grow to meet customer demand across the United States.”

Any shareholders wishing to keep up to date with Abingdon Health news, please email [email protected]

Enquiries

Abingdon Health plc

www.abingdonhealth.com/investors/

Chris Hand, Executive Chairman

Via Walbrook PR

Tom Hayes, CFO

Cavendish Capital Markets Limited (Sole Broker and Nominated Adviser)

 Tel: +44 (0)20 7220 0500

Geoff Nash / Isaac Hooper / Joe Smith (Corporate Finance)

Nigel Birks (Life Science Specialist Sales)

Walbrook PR (Media & Investor Relations)

Tel: +44 (0)20 7933 8780 or [email protected]

Paul McManus / Alice Woodings

Mob: +44 (0)7980 541 893 / +44 (0)7407 804 654

About Abingdon Health

Abingdon Health Group is a leading med-tech contract service provider offering its services to an international customer base.  

The Group’s CDMO (Contract Development and Manufacturing Organisation) expertise offers lateral flow product development, regulatory strategy support, technology transfer and manufacturing services for customers looking to develop new assays or transfer existing laboratory-based assays to a lateral flow format.  Abingdon Health has the internal capabilities to take lateral flow projects, in areas such as infectious disease and clinical testing, including companion diagnostics, animal health and environmental testing, from initial concept through to routine manufacturing; from idea to commercial success.

Abingdon’s regulatory services companies, Compliance Solutions (Life Sciences) and IVDeology, provide a broad range of regulatory services to the in vitro diagnostic and wider medical device industry, to support customers in bringing products to market across a range of territories including the USA, EU and the UK. Its consultancy services range from design, implementation and maintenance of quality management systems, preparation of technical files for regulatory approvals, part-time and interim management support, auditing both internal and external, management reviews and presentations, training and mentoring.  The Company’s subsidiary, Abingdon Analytical Ltd, offers analytical testing and performance evaluation to generate the required technical and data for regulatory approval for lateral flow and other in vitro diagnostic assays from its Doncaster, England facilities.

Founded in 2008, Abingdon Health is headquartered in York, England with laboratories in Doncaster, England and laboratories and commercial offices in Madison, Wisconsin, USA.

Abingdon Health’s brochures outlines the comprehensive support the Group can now provide to its international customers.  For more information visit: www.abingdonhealth.com.

Free Training

Source link

Gelatys Opens New $8 Million Production Facility, Expanding U.S. Manufacturing Capacity and Fueling National Grocery Growth


Gelatys Opens New $8 Million Production Facility, Expanding U.S. Manufacturing Capacity and Fueling National Grocery Growth

The #1 Gelato Frozen Novelties Brand in the U.S. Scales Production to Accelerate National Expansion

MIAMI, May 27, 2026 /PRNewswire/ — Gelatys, the #1 gelato frozen novelties brand in the United States and the only manufacturer of frozen gelato novelties in America, announced the opening of a new, state-of-the-art production facility in Fort Myers, FL. With an $8 million investment, the new 30,000+ square-foot facility is operational, signifying a key step in the company’s growth into a national CPG brand.

Built on a 1.5-acre site, the Fort Myers facility investment represents more than a manufacturing expansion; it’s the operational foundation Gelatys is building to support national grocery growth, fuel differentiated frozen-novelty innovation, and solidify its position as the defining brand in a category it pioneered. The site features next-generation machinery capable of producing in one hour what previously required an entire day. It will scale production to support the national expansion of Mini Gems, Gelatys’ premium, portion-controlled gelato mini pops, and the next generation of premium Italian-style frozen novelty innovation.

“When my family and I moved to Miami, Gelatys began as a dream to bring true artisanal gelato to the U.S. market. We quickly saw a larger opportunity; premium gelato novelties were not being manufactured at scale because of how technically complex they are. That challenge became our innovation story, pushing us to create our own processes, adapt machinery, and build products that did not yet exist in the market,” said Adolfo Joel Heller Cohen, Founder & CEO, Gelatys. “Our new Fort Myers facility isn’t just an expansion, it’s the infrastructure we always knew this brand would need when growing from a local concept into a national brand. We’re the only manufacturer of its kind in the United States, and we built that from scratch. The ambition that started Gelatys hasn’t changed, and looking ahead, we’re just getting started.”

The new facility reflects the full scope of Gelatys’ growth trajectory. Since launching as a two-kiosk mall concept in Miami in 2016, the brand has expanded to 5,000+ locations across 26 states, with a retail footprint that includes Whole Foods Market, Sprouts, Wegmans, H-E-B, Kroger banners including Mariano’s, QFC, Fred Meyer and King Soopers, The Fresh Market, and more.

Besides its manufacturing significance, the Fort Myers facility is creating approximately 75 new jobs in the region, adding to the roughly 50 employees that supported Gelatys’ original Miami facility. This new operation is the production backbone of what Gelatys is building, an American-made frozen gelato novelties brand designed to scale.

For more information about Gelatys and Mini Gems, visit gelatys.com or follow @gelatysusa on Instagram.

Media Contact
Amy Tew
310-351-4332
415099@email4pr.com

View original content to download multimedia:https://www.prnewswire.com/news-releases/gelatys-opens-new-8-million-production-facility-expanding-us-manufacturing-capacity-and-fueling-national-grocery-growth-302782761.html

SOURCE Gelatys


Free Training

Source link

OSH Cut Expands US Manufacturing Footprint with Second Factory in Cincinnati Region | Machine Maker – Latest Manufacturing News | Indian Manufacturing News – Latest Manufacturing News | Indian Manufacturing News


OSH Cut has announced that its second manufacturing facility in the United States is nearing operational readiness, marking a significant expansion of its on-demand metal fabrication capabilities. The new facility, located in the Cincinnati metropolitan area, spans approximately 70,000 square feet and represents an investment of nearly US$10 million. The company expects the project to generate around 70 new jobs as operations scale up over the coming months.

Headquartered in Spanish Fork, Utah, OSH Cut operates a self-service online platform that enables customers to order custom tube and sheet metal parts through a streamlined digital process. The company has built its reputation around rapid-turnaround fabrication services designed to support manufacturers, engineers, fabricators and industrial customers across the United States.

The Cincinnati-area expansion is aimed at increasing production capacity and improving service efficiency for customers located east of the Mississippi River, who currently account for nearly 43 percent of OSH Cut’s client base. By establishing a manufacturing presence closer to these customers, the company expects to reduce shipping times, improve delivery speeds and strengthen operational responsiveness.

The new facility will support a broad range of fabrication services offered by the company, including sheet metal cutting, brake bending, laser tube cutting, CNC tube bending, powder coating, metal finishing, tapping, countersinking and hardware insertion. According to the company, the expansion reflects growing demand for digitally enabled fabrication solutions that combine speed, flexibility and precision manufacturing. The facility is being equipped with advanced fabrication technologies designed to support high-volume and customised production requirements.

OSH Cut’s online ordering model allows customers to upload designs, receive instant pricing and place orders directly through its digital platform. The company said this technology-driven approach has enabled it to simplify traditional fabrication workflows while improving turnaround times for industrial clients.

The addition of the Cincinnati-area plant is expected to complement the company’s existing Utah operations while creating a more geographically balanced manufacturing network across the United States. The facility will play a key role in supporting future growth as demand for rapid, on-demand fabrication services continues to increase across sectors such as industrial manufacturing, automotive, construction and equipment production. With the second factory nearing completion, OSH Cut is positioning itself to expand its national reach and strengthen its ability to serve customers with faster production timelines and enhanced manufacturing flexibility.

Free Training

Source link

Skydio Commits $3.5 Bn to Expand U.S. Manufacturing and Secure American Drone Leadership


Skydio Commits $3.5 Bn to Expand U.S. Manufacturing and Secure American Drone Leadership  Skydio ©

Skydio ©

Skydio’s commitment is an investment in American drone dominance, powered by rapidly growing demand for autonomous flying robots that serve America’s critical industries.

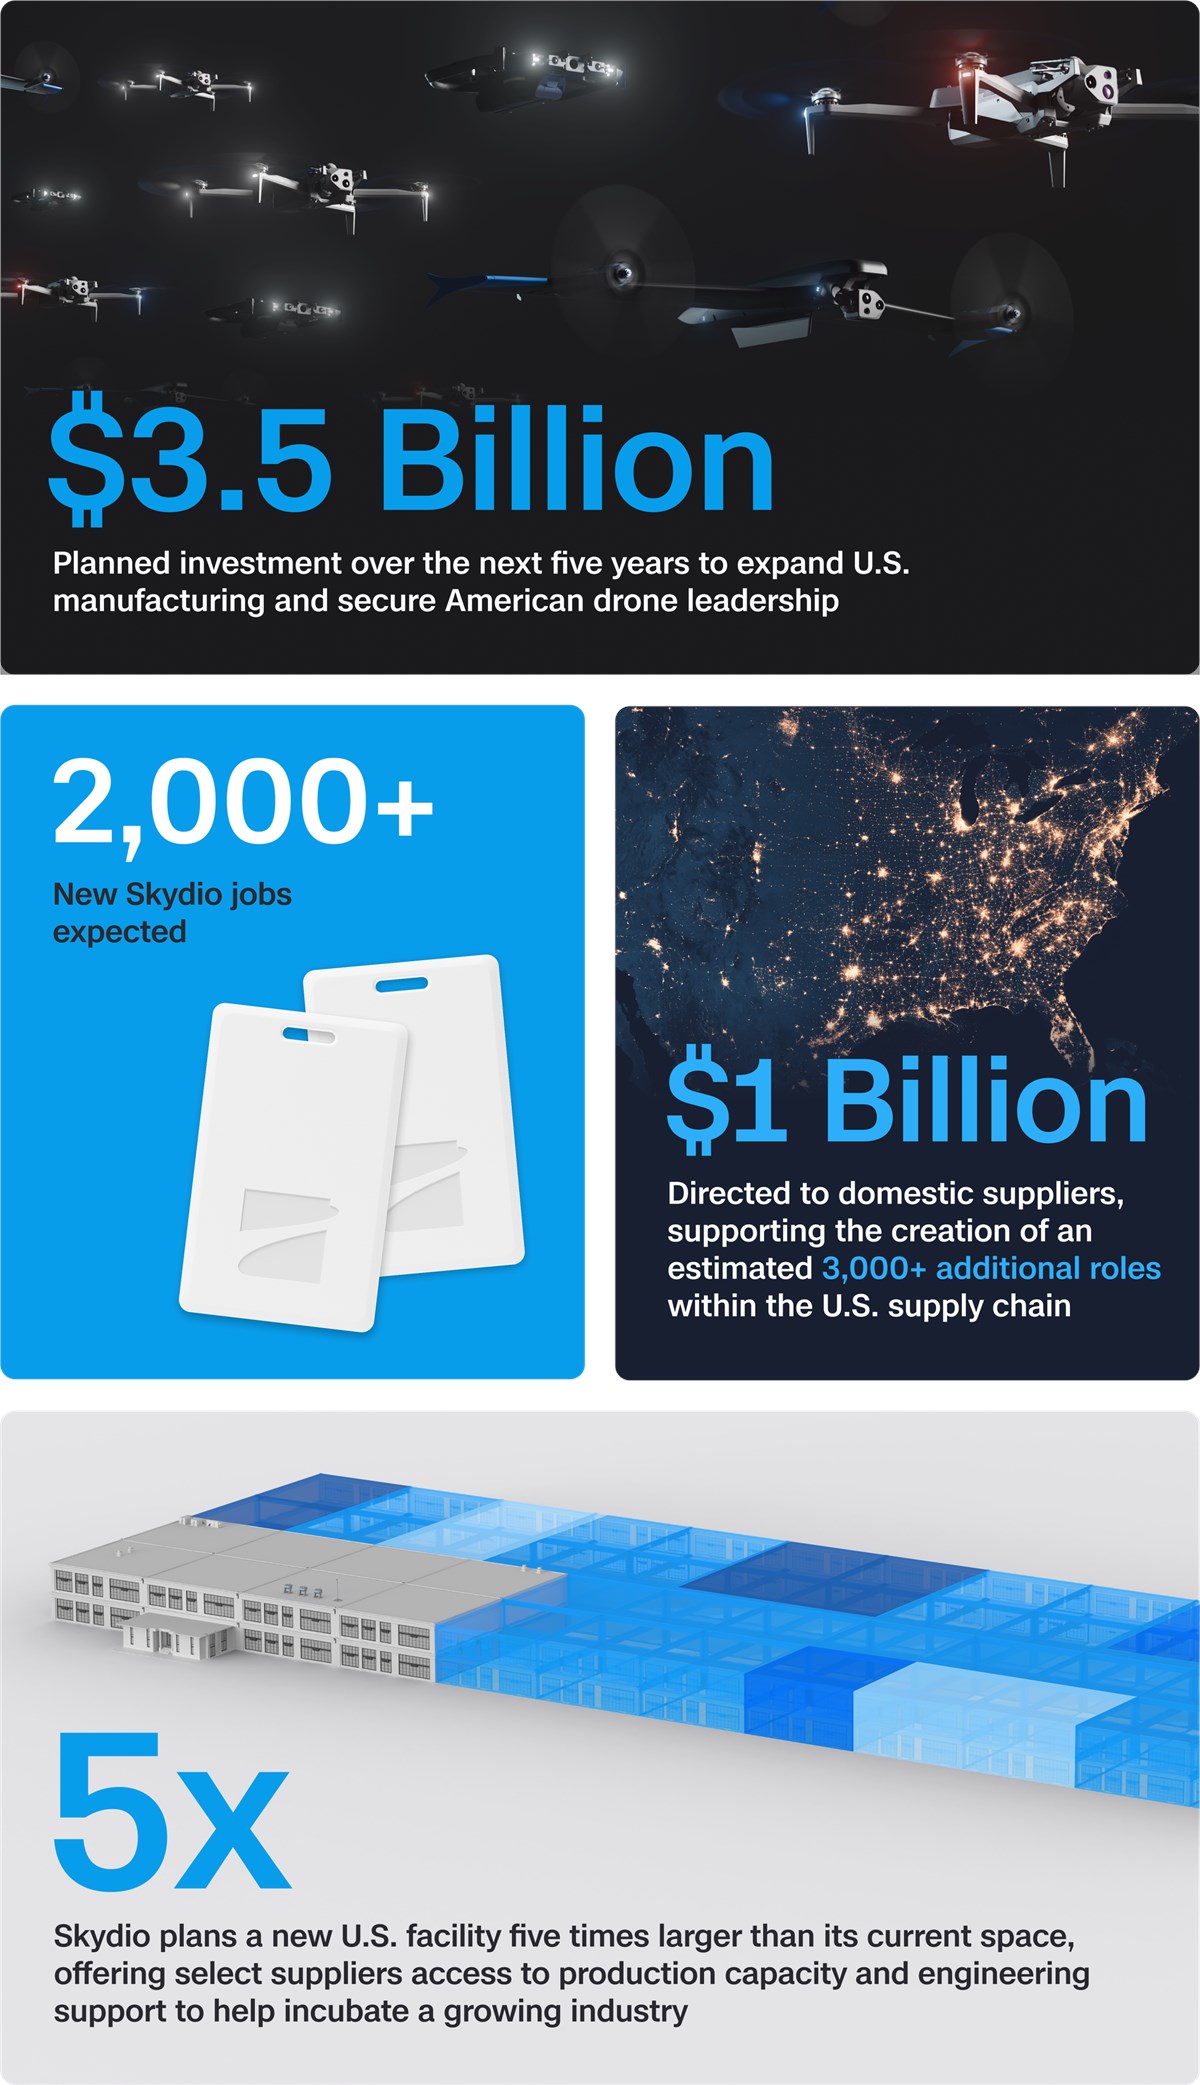
Skydio, the largest U.S.-based drone manufacturer and the world leader in flying robots, today announced plans to invest $3.5 billion in the United States over the next five years to expand its domestic manufacturing, accelerate R&D, and strengthen American supply chains. The investment is expected to create over 2,000 new Skydio jobs, support the creation of more than 3,000 additional roles within the U.S. supply chain, and direct more than $1 billion to domestic suppliers.

Skydio already manufactures more dual-use drones than any company outside of China. The company has shipped more than 60,000 flying robots to more than 3,800 customers, including more than 1,200 public safety agencies throughout the country, every branch of the U.S. military, and 29 allied nations, as well as more than 450 utility and energy companies.

A key component of the investment is SkyForge, a new company program designed to ensure the future of flight is built in America. In addition to the billion-dollar investment in U.S. suppliers, Skydio plans to open a new U.S. manufacturing facility five times larger than its current space. The company has outgrown four American manufacturing facilities in eight years; this will be its fifth expansion to meet extraordinary demand. Skydio’s investment in world-class suppliers will help expand – and in some cases initiate – domestic manufacturing of crucial parts and components. The company will invite select suppliers to co-locate production capacity with Skydio, giving suppliers access to production space and Skydio’s engineering talent to help incubate a growing industry.

In the span of little more than a decade, drones evolved from toys to tools to critical infrastructure for the industries that form the backbone of this country. Skydio leads this new era of drones as infrastructure on the strength of its AI and autonomy innovation: In public safety, for example, our Skydio DFR gives agencies aerial awareness that allows drones to arrive on scene first 71% of the time, resolving nearly a quarter of calls without sending a patrol unit. When lives and livelihoods are on the line, Skydio’s systems are in the field, every day, protecting both.

With this commitment, Skydio is making clear that the United States will lead in flying robotics autonomy, manufacturing, and scale. The investment will reinforce domestic electronics and component manufacturing and strengthen secure supply chains vital to national resilience. At the same time, Skydio will continue to scale domestic production capacity to meet the growing demand across public safety, national security, and utilities.

Free Training

Source link

A Keystone for Economic Statecraft


Editor’s note: This is the ninth article in an 11-part series examining how the United States should organize, lead, and integrate economic statecraft into strategy, defense practice, and the broader national security ecosystem. The special series is brought to you by the Potomac Institute for Policy Studies and War on the Rocks. Prior installments can be found at the War by Other Ledgers page.

In September 2010, after a Chinese fishing trawler captain was detained near the Senkaku Islands, Beijing halted rare-earth exports to Japan. The embargo lasted weeks. China showed, on a U.S. treaty ally, how a supply chain could be weaponized. Washington failed to respond. Nor did America generalize the lesson. Instead, it benefited from deflation as it increased its dependency on China over the past 20 years. The number of Chinese companies exporting into the U.S. manufacturing supply chain rose from 10,500 to 39,000 from 2005 to 2024.

China’s rare earths actions are just the tip of the spear — the shaft is now coming through the bulwarks. High quality Chinese vehicles, unimaginable in Western markets a decade ago, are displacing incumbents across Europe, Latin America, and Southeast Asia. Canada, America’s largest trading partner, is considering Build Your Dreams (BYD) assembly plants on its own soil. Chinese firms hold ownership stakes in roughly 10,000 U.S. auto-parts suppliers. China’s share of global manufacturing exports climbed from 5 percent in 2000 to 20 percent in 2023, while America’s fell from 14 to 8 percent during that time. Not even COVID-19, which should have been a wakeup call, stirred America to address its own dependencies. Put succinctly by Craig Tindale, an investment manager, “A country that cannot make, refine, power, move, and repair the physical systems it depends on can be remote controlled by a country that can.”

The case for action is not only strategic. Manufacturing is among the most economically stimulative sectors in the U.S. economy: Every dollar of manufacturing output generates  $2.69 in total economic activity, and every direct manufacturing job supports roughly five others, with every dollar of manufacturing wages generating $4.33 in total labor income. Advanced manufacturing, robotics, and AI will widen those ratios as well as increase productivity. China’s industrial productivity gains have tracked closely with its robotics adoption, which far exceeds that of America’s. This makes growing the manufacturing base  more important, not less, to sustain high employment and GDP.

The U.S. government has already made a few moves to address the challenge, including the One Big Beautiful Bill of 2025, the Office of Strategic Capital’s $200 billion authority, and the rare-earth and Pax Silica initiatives. While necessary to boost the defense industrial base, these actions do not reach the broader commercial and industrial base or the “missing middle”: the hundreds of thousands of manufacturers and dual-use suppliers that are the heart of America’s production base.

Here, I endeavor to make the case for revitalizing American manufacturing by explaining why economic statecraft fails without commercial manufacturing competitiveness; how, unlike software and services, manufacturing delivers low profitability, is starved for capital, and offers thin entrepreneurial rewards; which free-market levers could make America more competitive; and finally, what Congress should do, and when. It took 30 years for the United States to lose manufacturing. Rebuilding it will not be fast, easy, or free.

Economic Statecraft Requires Near-Competitive Products

Economic statecraft involves offering superior products to allies at near-competitive prices, setting technical standards, building supply chain dependencies that create leverage, and threatening to withhold what you can provide credibly.

As the United States outsourced manufacturing in recent decades, it benefited from importing deflation. Yet, at the same time, it lost foundational capabilities in shipbuilding, rare-earths processing, and producing pharmaceuticals, semiconductors, drones, robots, and batteries, among other products. This has put a significant drain on GDP. Meanwhile, according to the Rhodium Group, an independent research firm:

China’s industrial policy is becoming more systemic and pervasive, extending across all layers of production from upstream inputs and industrial equipment to downstream applications, services, and frontier technologies … Beijing also increasingly deploys policy tools to entrench its dominant position in global value chains and counter foreign diversification strategies.

With 330 million people, versus China’s 1.4 billion, the United States acting alone loses on scale. Instead, it needs the collective volume of its traditional allies and partners. With a total population of 2.7 billion and combined GDP of $34 trillion, Europe, Japan, South Korea, India, Australia, and much of Southeast Asia have the capital, technology, and market depth to compete with China. The math works, but only if American manufacturing can deliver on feature, function, scale, and price. Pivoting from a blunt tariff-centric approach to a tariff- and coalition-building one may be the glaring opportunity that U.S. leaders can soon (re)embrace.

Under the second Trump administration, a renewed strategic focus on the Western hemisphere shows progress with receding Chinese influence in Central and South America, including Panama, Peru, and Chile. However, as the United States reasserts itself, trade is needed to back it up. Over the last 25 years, Chinese trade in the region has grown from virtually nothing to half a trillion dollars a year. Already by 2015, Beijing was the top trading partner for most of South America. Since then, it has become an even more significant economic player. Chinese exports of consumer goods, high-end electronics, and cars undercut U.S.-made products, while its outsized demand for commodities has drawn the region further into its orbit. Recapturing these markets requires competitive products.

Wealthy and Impotent

America is caught in a trap. Despite an immense debt load, the U.S. economy remains the envy of the world: GDP growth leads the G7 and unemployment is near historic lows. The world’s deepest capital markets, the world’s reserve currency, and, historically, the strongest alliance network in history, undergird America’s military and deficit spending. Unresolved is the balance of cost and benefits accruing to the reserve currency holder. However that argument resolves, a competitive manufacturing base is required to practice economic statecraft effectively. For example, the United States and Canada have long co-built automobiles. As Canada — America’s second-largest trading partner — considers building Chinese BYD car factories at home, the message is clear: China’s manufacturing depth, rapid product cycles, and leading battery technology deliver inexpensive, feature-rich cars. Were Canada to strongly embrace Chinese vehicles, its trading relationship with America could fracture.

Ford is responding and expects to deliver a Tesla-competitive car in mid-2027 at BYD-level manufacturing costs. Ford’s actions will roll through its supplier base, spurring upstream reshoring, reinvestment, and revival. Such investments should be replicated widely.

Capital without manufacturing becomes financial extraction, not strategic investment. S&P 500 companies returned over $12 trillion to shareholders through buybacks and dividends between 2015 and 2024 — capital that did not build factories. Innovation without production becomes a gift to competitors. The United States invents while China manufactures. Yet, America’s import dependence — offshoring manufacturing on the promise of higher profits via lower manufacturing costs in China — gave Beijing the opportunity to scale as it innovated, copied, or stole capabilities.

Leveraging America’s Strengths

America’s institutional advantages are as real as its capital advantages. The United States combines an unusually high tolerance for entrepreneurial failure, a globally dominant startup ecosystem, deep public-private research capacity, and a venture-capital-centered financial architecture that rapidly flows capital to new ideas. However, without competitive manufacturing, capabilities, skills, and capacity atrophy. A country, or Congress, unable to finance manufacturing companies through the so-called valley of death from prototype to scale production or rebuilding capacity with software-led advanced capabilities.

Rebuilding the missing middle would strengthen every dimension of U.S. economic statecraft, deepening the production base that makes leverage real, reducing the import dependencies that adversaries exploit, and restoring the manufacturing credibility that makes the allied coalition offer credible.

The choice America faces is either rebuilding critical domestic manufacturing or continued dependence on China. Currently, 70,000 American manufacturing companies import from 45,000 Chinese suppliers (notably, the 45,000 companies themselves buy from other Chinese manufacturers). Rebuilding imputes a necessary choice: manufacturing output with automation-augmented jobs, a Rubicon China crossed years ago. As a result, Chinese workers produce considerably more physical output per worker than do Americans — that lead compounds.

Japan has eagerly adopted robots to improve productivity and offset a decline in its working population. It has about 70 percent of the global market for robots. In the 1980s, America adopted lean manufacturing, Japanese management, and production technologies. Incentivized with capital and talent, America’s entrepreneurs will be eager to learn from Japan and any other company or country.

One source of knowledge and experience will come from integrating defense manufacturing knowledge into commercial manufacturing, including in software, robotics, and AI augmentation. Defense firms including Hadrian, Anduril, and Divergent are leading the way, while Tesla is doing so in the non-defense sector. Green shoots — in the form of software, AI, marketplaces, and robot companies — are beginning to appear.

Robotics adoption should not be mandated or directed by government fiat. Instead, monetary incentives can help the free market rebuild domestic manufacturing.

A revitalized manufacturing sector with workers overseeing AI-optimized factory floors is how America leapfrogs its lost industrial base — and it’s a big leap. The scope — likely hundreds of thousands of companies — is too large for government programs to pick winners. The incentives should be free-market oriented and directed towards increasing domestic manufacturing value. Free-market means available to any manufacturing company, meeting some set of requirements, not going through a lengthy government application process, and not a function of personal or political connections.

What To Do

The free market is America’s superpower. It’s time to release it in three ways to rebuild domestic manufacturing. First, improving income statements through transferable tax credits scaled to the percentage of domestic value added which directly improves profitability. Second, making credit more available via Mannie-Mac, bank-delivered low-cost manufacturing loans, funding expansion, investment, and improving profitability through a lower cost-of-capital. Third, increasing rewards for entrepreneurs via a qualified small business stock-style exemption, designed for founders and leaders running and growing manufacturing firms, rewarding operators, not investors, for building manufacturing companies.

Improving Income Statements

It is no surprise that capital has fled manufacturing — it returns less money than other sectors. The result is a self-reinforcing cycle of low profitability, underinvestment, and capability attrition and outsourcing.

New York University Professor Aswath Damodaran provides the most comprehensive public data and analysis for corporate comparisons. Against broad manufacturing in the United States, software, business services, and consumer services companies earn about 1.8 times the return on capital. Against more narrowly focused capital-intensive sectors, the multiples are far starker, with software approximately 6 times more, services nearly 5.7 times more, and pharmaceuticals about 3.4 times more.

Transferable tax credits, scaled to the percentage of domestic value added, can deliver direct income statement support to established, middle market, and start-up companies as they invest in new facilities, equipment, products, people, and markets. Improved profitability improves return on investment, attracting capital and talent.

Increasing Capital Availability

Beyond profitability, the high cost of capital, when it is available, compounds the low return problem. U.S. small-to-midsize manufacturing firms borrow at 7 to 11 percent more than in China. Small Business Administration loans, limited to five million dollars, charge 10 to 12 percent.

Independent of the cost of capital, the United States banking system does not finance domestic manufacturing at the scale or terms that a reshoring agenda requires. The competitive disadvantage for U.S. manufacturers is a profitability, capital cost, and capital availability problem that tax policy alone (including the One Big Beautiful Bill) does not solve. Scaling production requires more money.

Mannie Mac, low-cost capital delivered by banks directly to companies, gets both the government out of winner-picking and companies out of multi-year application processes. Like Fannie Mae and Freddie Mac, which drove home ownership, Mannie Mac can support mid-size companies in investing in advanced manufacturing to gain capacity, scale, and price.

Rewarding Entrepreneurs

Entrepreneurialism is another American superpower. Entrepreneurs and their employees take risks joining small companies, investing their time and sometimes capital in exchange for equity with the expectation of larger returns. However, since manufacturing companies generally return less money than software and services companies attracting talent to manufacturing requires the promise of additional returns.

The current applicable program, the qualified small business stock, rewards investors and employees with capital gains tax exemption, with strict $15 million limits per person or 10 times the share cost basis —whichever is greater. However, the program applies only to C corporations, while many start-ups, family businesses, and existing manufacturing companies are S corporations or limited liability companies.

The most direct free-market reward for entrepreneurs is money. Whether a founder buys an existing manufacturing business or starts a new one, increasing the monetary reward via a manufacturing-only capital gains tax exemption tilts the entrepreneurial calculus where it is needed. A significant capital gains exemption program, up to $250 million, across operational equity holders can support manufacturing company transitions from baby boomers to their children, and founders and management starting and running manufacturing companies.

More than 100,000 manufacturing companies are expected to undergo ownership transition over the next decade as baby boomer founders retire. Without intervention, these companies face private equity acquisition for asset extraction, sale to foreign buyers, and closure.

Talent follows capital, and capital follows returns.

Conclusion

Manufacturing competitiveness is the precondition for every other instrument of American power.

A country cannot practice economic statecraft effectively without competitive products to offer, withhold, and build upon. The military cannot defend the country without the industrial base to produce what defense requires at price and scale. The United States will not lead the technological future without the physical infrastructure to manufacture it, and America cannot make the allied coalition math work without a credible economic offer that closes the gap.

Solving for manufacturing means solving for relative profitability and returns, supplying low-cost capital for scale, innovation, and reshoring, and rewarding entrepreneurs for founding and running manufacturing companies. This takes U.S. government leadership and action. It will not happen by itself.

America is wealthy in the assets that matter — capital, talent, alliances, and innovation — and increasingly unable to deploy them because those assets lack physical expression. With every quarter that the manufacturing base continues to hollow out, the gap between America’s potential and its deployable statecraft capacity widens.

America’s superpower remains the free market, which responds to incentives. If America wants a different outcome, incentives should be changed — it cannot “winner-pick” its way to success. Government policy should not pick winners and must address upstream and downstream supply chains. Targeted industrial policy risks stranding isolated capacity, and current efforts on rare earths and semiconductors carry this risk. China has been building deep supply chains, while America has been losing them.

The investment required to compete is a fraction of the cost of the alternative — an America that cannot produce what its statecraft requires.


Mark Rosenblatt runs Rationalwave Capital Partners, an early-stage venture fund. He has analyzed, founded, ran, sold, and invested in technology companies for 45 years.

Image: Maurizio Pesce via Wikimedia Commons.

Free Training

Source link

Novartis Finalizes $23 Billion U.S. Investment Plan with Seventh New Manufacturing Facility


Novartis has reached the final milestone of its $23 billion domestic investment strategy, announcing a seventh new facility in Morrisville, North Carolina. The 56,200-square-foot plant will focus on active pharmaceutical ingredient (API) manufacturing for solid dosage forms and RNA therapeutics. This addition completes a one-year expansion cycle aimed at establishing a fully autonomous, end-to-end supply chain within the United States. By localized production, the Swiss drugmaker seeks to insulate its American patient base from global logistics volatility and potential pharmaceutical import tariffs.

The expansion marks the first time in Novartis’ history that all its advanced technology platforms—including radioligand, cell and gene therapies, and small molecules—will be manufactured domestically. Over the past 12 months, the firm has broken ground on research centers in San Diego and flagship hubs in the Research Triangle, while also building a coast-to-coast radioligand therapy (RLT) network with new sites in Texas, Florida, and California. CEO Vas Narasimhan noted that the connected footprint allows the firm to “locally develop, produce, and deliver medicines at scale.”This surge in infrastructure is designed to provide “timely access to innovation for patients in the U.S.”

Since launching the initiative in April 2025, Novartis has committed to manufacturing all its key medicines for U.S. patients within the country. The Morrisville site specifically complements existing North Carolina facilities focused on biologics and sterile packaging, creating a regional hub for oncology, immunology, and cardiovascular treatments. This infrastructure push coincides with a broader industry shift toward regionalized manufacturing as a hedge against geopolitical uncertainty. As the company nears full operational status for its new sites, it remains on track to integrate discovery and production more tightly than ever before across its 10-site U.S. network.

Read more

Free Training

Source link

Manufacturing Energy and Carbon Footprints (2018 MECS)


Note: This page was published in December 2021 with the most recent Manufacturing Energy and Carbon Footprints, using 2018 U.S. Energy Information Administration (EIA) Manufacturing Energy Consumption Survey (MECS) data and updated assumptions. Earlier versions of the footprints are still available: 2014 EIA MECS data footprints, 2010 EIA MECS data footprints, and 2006 EIA MECS data footprints. Detailed analysis of the footprints and sector rankings, utilizing 2006 data, is available in the U.S. Manufacturing Energy Use and Greenhouse Gas Emissions Analysis report. For more information, reach out to us.

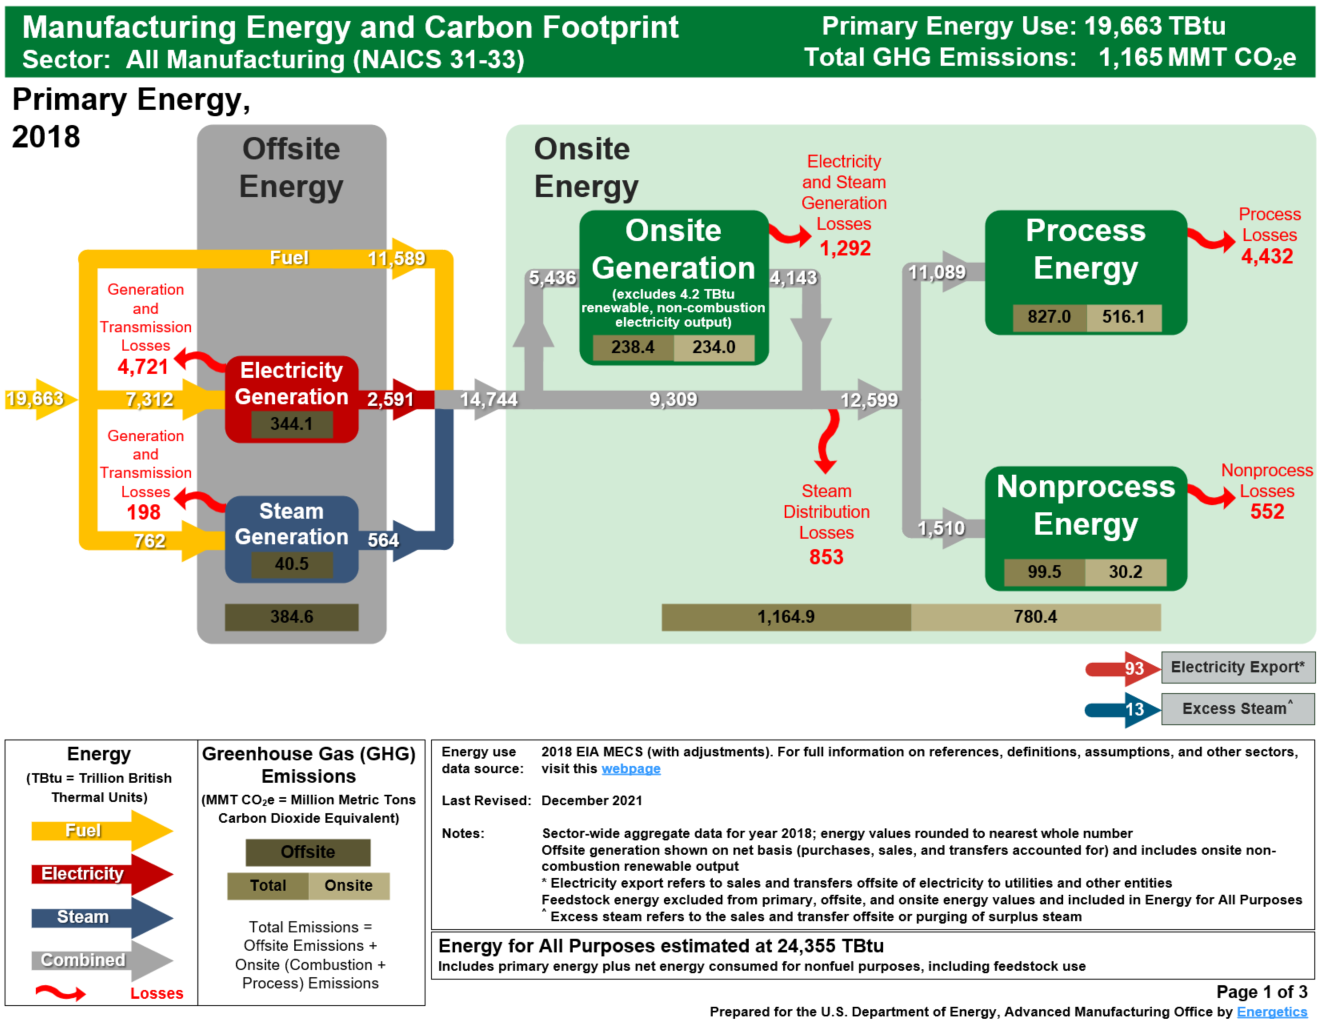
Manufacturing Energy and Carbon Footprints map the flow of energy supply, demand, and losses as well as greenhouse gas (GHG) emissions in diverse U.S. manufacturing industries, based on EIA MECS and U.S. Environmental Protection Agency (EPA) emissions data.

The footprints show where energy is used and lost in manufacturing—and the associated combustion and process greenhouse gas (GHG) emissions. Each footprint visualizes the flow of energy (in the form of fuel, electricity, or steam) to major end uses in manufacturing, including boilers, combined heat and power generation, process heaters, process coolers, machine-driven equipment, facility HVAC. The GHG emissions associated with energy generation and end use are also mapped.

AVAILABLE 2018 DATA FOOTPRINTS

Footprints are available for 15 manufacturing sectors, that collectively represent 95% of U.S. manufacturing primary energy use, 5 manufacturing subsectors, and U.S. manufacturing as a whole in 2018. Each of the 21 footprints are accessible through the links below. To download all footprints, click here.

FOOTPRINT CONTENT

The footprints present data at three levels of detail. The first page provides a high-level view of primary energy for heat and power (offsite and onsite), while the second page shows details of how energy is distributed to onsite end uses. The third page depicts the GHG emissions from each point of energy generation, end use, and non-combustion sources (i.e., industrial process emissions). The analyses are based on manufacturing energy consumption data from EIA’s Manufacturing Energy Consumption Survey (MECS), along with referenced energy loss and emission factors, and input from industry and subject matter experts. Greenhouse gas emissions analysis combines data from MECS as well as EPA’s Inventory of U.S. Greenhouse Gas Emissions and Sinks.

Aggregate data provided in each of the sectors includes:

  • Electricity and steam generated offsite and transferred to the facility
  • Electricity and steam generated onsite
  • Fuel, electricity, and steam consumed by major end uses in a manufacturing facility
  • Offsite and onsite energy losses due to the generation, transmission and distribution, and end use consumption of energy (some losses are unrecoverable)
  • Greenhouse gas emissions emitted during fuel combustion and byproducts of various non-energy-related manufacturing processes

FOOTPRINT PURPOSE

Footprints can help users better understand the distribution of energy use and compare use, loss, and GHG emissions within and across U.S. manufacturing sectors. Areas of significant energy consumption, energy losses, and/or GHG emissions could indicate improvement opportunities by implementing energy management best practices, upgrading energy systems, or developing new technologies. The footprints provide a macro-scale benchmark for evaluating energy and GHG emissions and for prioritizing opportunity analysis.

ADDITIONAL ANALYSIS

The U.S. Manufacturing Energy Use and Greenhouse Gas Emissions Analysis report expands on the Energy and Carbon Footprints for 2006 to trace energy from supply (fuel, electricity, and steam) to major end-use applications in U.S. manufacturing. The report ranks the energy use, energy losses, and greenhouse gas (GHG) combustion emissions of 15 sectors.

Free Training

Source link

Japanese Yen falls amid strong US Manufacturing PMI


The USD/JPY pair rose toward the 159.30 price zone, closing in on the 160.00 level, which usually prompts intervention by the Bank of Japan (BoJ).

The latest S&P Global flash Purchasing Managers Index (PMI) data showed the US Composite PMI held steady at 51.7 in May, matching April’s reading and signaling continued economic expansion. Manufacturing activity improved further, with the Manufacturing PMI rising to 55.3 from 54.5, surpassing market expectations of 54.0. Meanwhile, the Services PMI eased slightly to 50.9 from 51.0, highlighting softer momentum in the service sector.

According to S&P Global, “business activity continued to grow in May but at a reduced rate compared to that seen earlier in the year,” while the report also noted that service sector growth remains sluggish amid only modest improvements in new business inflows. The stronger manufacturing figures helped support the Greenback as traders reassessed expectations for Federal Reserve (Fed) rate cuts.

US Treasury Secretary Scott Bessent stated that the United States and Japan agree that excessive volatility in currency markets is undesirable, comments interpreted as indirect support for Tokyo’s recent intervention efforts to stabilize the Yen. Bessent also expressed confidence that Bank of Japan (BoJ) Governor Kazuo Ueda will successfully guide monetary policy and avoid falling behind inflation pressure.

Chart Analysis USD/JPY

USD/JPY technical analysis:

On the 4-hour chart, USD/JPY trades at 159.19. The pair retains a bullish near-term bias as price holds above both the 20-period Simple Moving Average (SMA) around 158.99 and the 100-period SMA near 157.82, keeping the broader uptrend structure intact. The horizontal line drawn at 159.19 is being tested as a pivot area, while the Relative Strength Index (RSI) eases back toward 68, hinting that upside momentum remains constructive but is edging closer to overbought territory, which could slow the pace of further gains.

On the topside, immediate resistance is seen at the 159.19 pivot area, followed by the horizontal barrier at 159.35, where a clear break would open the way to fresh highs in the near term. On the downside, initial support is located at 159.09, ahead of the 20-period SMA and the horizontal level at 158.90, with the 100-period SMA providing a deeper dynamic floor if a corrective pullback extends.

(The technical analysis of this story was written with the help of an AI tool.)

Free Training

Source link

STATS Group Expands North American Operations with New Texas Manufacturing Plant | 2026 – News and Statistics


May 24, 2026

STATS Group has significantly expanded its North American operations, according to a report from OGN/TradeArabia News Service. The company has opened an 80,000-square-foot manufacturing facility in Rosenberg, Texas, marking its first dedicated production site in the United States and representing the largest capital investment in the organization’s history.

Facility and Production

The new site will manufacture pipeline fittings, specifically hot tap and line stop components. It includes a modern machine shop tailored to support STATS Group’s proprietary equipment.

Strategic Goals

The expansion is designed to reduce lead times, enhance product quality, and address increasing customer demand for locally manufactured solutions within the U.S. energy sector. The facility is supported by the company’s existing Houston office, which strengthens STATS Group’s end-to-end service capability across North America.

According to the company, the investment reflects rising demand for faster delivery, greater responsiveness, and improved manufacturing control. STATS Group expects the U.S. manufacturing base to substantially boost service delivery and aligns the move with its broader global growth strategy, which prioritizes local investment, scalability, and closer alignment with client needs.

  1. 1. INTRODUCTION

    Making Data-Driven Decisions to Grow Your Business

    1. REPORT DESCRIPTION
    2. RESEARCH METHODOLOGY AND THE AI PLATFORM
    3. DATA-DRIVEN DECISIONS FOR YOUR BUSINESS
    4. GLOSSARY AND SPECIFIC TERMS
  2. 2. EXECUTIVE SUMMARY

    A Quick Overview of Market Performance

    1. KEY FINDINGS
    2. MARKET TRENDS This Chapter is Available Only for the Professional EditionPRO
  3. 3. MARKET OVERVIEW

    Understanding the Current State of The Market and its Prospects

    1. MARKET SIZE: HISTORICAL DATA (2012–2025) AND FORECAST (2026–2035)
    2. CONSUMPTION BY COUNTRY: HISTORICAL DATA (2012–2025) AND FORECAST (2026–2035)
    3. MARKET FORECAST TO 2035
  4. 4. MOST PROMISING PRODUCTS FOR DIVERSIFICATION

    Finding New Products to Diversify Your Business

    1. TOP PRODUCTS TO DIVERSIFY YOUR BUSINESS
    2. BEST-SELLING PRODUCTS
    3. MOST CONSUMED PRODUCTS
    4. MOST TRADED PRODUCTS
    5. MOST PROFITABLE PRODUCTS FOR EXPORT
  5. 5. MOST PROMISING SUPPLYING COUNTRIES

    Choosing the Best Countries to Establish Your Sustainable Supply Chain

    1. TOP COUNTRIES TO SOURCE YOUR PRODUCT
    2. TOP PRODUCING COUNTRIES
    3. TOP EXPORTING COUNTRIES
    4. LOW-COST EXPORTING COUNTRIES
  6. 6. MOST PROMISING OVERSEAS MARKETS

    Choosing the Best Countries to Boost Your Export

    1. TOP OVERSEAS MARKETS FOR EXPORTING YOUR PRODUCT
    2. TOP CONSUMING MARKETS
    3. UNSATURATED MARKETS
    4. TOP IMPORTING MARKETS
    5. MOST PROFITABLE MARKETS
  7. 7. PRODUCTION

    The Latest Trends and Insights into The Industry

    1. PRODUCTION VOLUME AND VALUE: HISTORICAL DATA (2012–2025) AND FORECAST (2026–2035)
    2. PRODUCTION BY COUNTRY: HISTORICAL DATA (2012–2025) AND FORECAST (2026–2035)
  8. 8. IMPORTS

    The Largest Import Supplying Countries

    1. IMPORTS: HISTORICAL DATA (2012–2025) AND FORECAST (2026–2035)
    2. IMPORTS BY COUNTRY: HISTORICAL DATA (2012–2025) AND FORECAST (2026–2035)
    3. IMPORT PRICES BY COUNTRY: HISTORICAL DATA (2012–2025) AND FORECAST (2026–2035)
  9. 9. EXPORTS

    The Largest Destinations for Exports

    1. EXPORTS: HISTORICAL DATA (2012–2025) AND FORECAST (2026–2035)
    2. EXPORTS BY COUNTRY: HISTORICAL DATA (2012–2025) AND FORECAST (2026–2035)
    3. EXPORT PRICES BY COUNTRY: HISTORICAL DATA (2012–2025) AND FORECAST (2026–2035)
  10. 10. PROFILES OF MAJOR PRODUCERS

    The Largest Producers on The Market and Their Profiles

  11. 11. COUNTRY PROFILES

    The Largest Markets And Their Profiles

    This Chapter is Available Only for the Professional Edition
    PRO

    1. 11.1

      United States

      • Market Size
      • Production
      • Imports
      • Exports
    2. 11.2

      China

      • Market Size
      • Production
      • Imports
      • Exports
    3. 11.3

      Japan

      • Market Size
      • Production
      • Imports
      • Exports
    4. 11.4

      Germany

      • Market Size
      • Production
      • Imports
      • Exports
    5. 11.5

      United Kingdom

      • Market Size
      • Production
      • Imports
      • Exports
    6. 11.6

      France

      • Market Size
      • Production
      • Imports
      • Exports
    7. 11.7

      Brazil

      • Market Size
      • Production
      • Imports
      • Exports
    8. 11.8

      Italy

      • Market Size
      • Production
      • Imports
      • Exports
    9. 11.9

      Russian Federation

      • Market Size
      • Production
      • Imports
      • Exports
    10. 11.10

      India

      • Market Size
      • Production
      • Imports
      • Exports
    11. 11.11

      Canada

      • Market Size
      • Production
      • Imports
      • Exports
    12. 11.12

      Australia

      • Market Size
      • Production
      • Imports
      • Exports
    13. 11.13

      Republic of Korea

      • Market Size
      • Production
      • Imports
      • Exports
    14. 11.14

      Spain

      • Market Size
      • Production
      • Imports
      • Exports
    15. 11.15

      Mexico

      • Market Size
      • Production
      • Imports
      • Exports
    16. 11.16

      Indonesia

      • Market Size
      • Production
      • Imports
      • Exports
    17. 11.17

      Netherlands

      • Market Size
      • Production
      • Imports
      • Exports
    18. 11.18

      Turkey

      • Market Size
      • Production
      • Imports
      • Exports
    19. 11.19

      Saudi Arabia

      • Market Size
      • Production
      • Imports
      • Exports
    20. 11.20

      Switzerland

      • Market Size
      • Production
      • Imports
      • Exports
    21. 11.21

      Sweden

      • Market Size
      • Production
      • Imports
      • Exports
    22. 11.22

      Nigeria

      • Market Size
      • Production
      • Imports
      • Exports
    23. 11.23

      Poland

      • Market Size
      • Production
      • Imports
      • Exports
    24. 11.24

      Belgium

      • Market Size
      • Production
      • Imports
      • Exports
    25. 11.25

      Argentina

      • Market Size
      • Production
      • Imports
      • Exports
    26. 11.26

      Norway

      • Market Size
      • Production
      • Imports
      • Exports
    27. 11.27

      Austria

      • Market Size
      • Production
      • Imports
      • Exports
    28. 11.28

      Thailand

      • Market Size
      • Production
      • Imports
      • Exports
    29. 11.29

      United Arab Emirates

      • Market Size
      • Production
      • Imports
      • Exports
    30. 11.30

      Colombia

      • Market Size
      • Production
      • Imports
      • Exports
    31. 11.31

      Denmark

      • Market Size
      • Production
      • Imports
      • Exports
    32. 11.32

      South Africa

      • Market Size
      • Production
      • Imports
      • Exports
    33. 11.33

      Malaysia

      • Market Size
      • Production
      • Imports
      • Exports
    34. 11.34

      Israel

      • Market Size
      • Production
      • Imports
      • Exports
    35. 11.35

      Singapore

      • Market Size
      • Production
      • Imports
      • Exports
    36. 11.36

      Egypt

      • Market Size
      • Production
      • Imports
      • Exports
    37. 11.37

      Philippines

      • Market Size
      • Production
      • Imports
      • Exports
    38. 11.38

      Finland

      • Market Size
      • Production
      • Imports
      • Exports
    39. 11.39

      Chile

      • Market Size
      • Production
      • Imports
      • Exports
    40. 11.40

      Ireland

      • Market Size
      • Production
      • Imports
      • Exports
    41. 11.41

      Pakistan

      • Market Size
      • Production
      • Imports
      • Exports
    42. 11.42

      Greece

      • Market Size
      • Production
      • Imports
      • Exports
    43. 11.43

      Portugal

      • Market Size
      • Production
      • Imports
      • Exports
    44. 11.44

      Kazakhstan

      • Market Size
      • Production
      • Imports
      • Exports
    45. 11.45

      Algeria

      • Market Size
      • Production
      • Imports
      • Exports
    46. 11.46

      Czech Republic

      • Market Size
      • Production
      • Imports
      • Exports
    47. 11.47

      Qatar

      • Market Size
      • Production
      • Imports
      • Exports
    48. 11.48

      Peru

      • Market Size
      • Production
      • Imports
      • Exports
    49. 11.49

      Romania

      • Market Size
      • Production
      • Imports
      • Exports
    50. 11.50

      Vietnam

      • Market Size
      • Production
      • Imports
      • Exports
  12. LIST OF TABLES

    1. Key Findings In 2025
    2. Market Volume, In Physical Terms: Historical Data (2012–2025) and Forecast (2026–2035)
    3. Market Value: Historical Data (2012–2025) and Forecast (2026–2035)
    4. Per Capita Consumption, by Country, 2022–2025
    5. Production, In Physical Terms, By Country: Historical Data (2012–2025) and Forecast (2026–2035)
    6. Imports, In Physical Terms, By Country: Historical Data (2012–2025) and Forecast (2026–2035)
    7. Imports, In Value Terms, By Country: Historical Data (2012–2025) and Forecast (2026–2035)
    8. Import Prices, By Country: Historical Data (2012–2025) and Forecast (2026–2035)
    9. Exports, In Physical Terms, By Country: Historical Data (2012–2025) and Forecast (2026–2035)
    10. Exports, In Value Terms, By Country: Historical Data (2012–2025) and Forecast (2026–2035)
    11. Export Prices, By Country: Historical Data (2012–2025) and Forecast (2026–2035)
  13. LIST OF FIGURES

    1. Market Volume, In Physical Terms: Historical Data (2012–2025) and Forecast (2026–2035)
    2. Market Value: Historical Data (2012–2025) and Forecast (2026–2035)
    3. Consumption, by Country, 2025
    4. Market Volume Forecast to 2035
    5. Market Value Forecast to 2035
    6. Market Size and Growth, By Product
    7. Average Per Capita Consumption, By Product
    8. Exports and Growth, By Product
    9. Export Prices and Growth, By Product
    10. Production Volume and Growth
    11. Exports and Growth
    12. Export Prices and Growth
    13. Market Size and Growth
    14. Per Capita Consumption
    15. Imports and Growth
    16. Import Prices
    17. Production, In Physical Terms: Historical Data (2012–2025) and Forecast (2026–2035)
    18. Production, In Value Terms: Historical Data (2012–2025) and Forecast (2026–2035)
    19. Production, by Country, 2025
    20. Production, In Physical Terms, by Country: Historical Data (2012–2025) and Forecast (2026–2035)
    21. Imports, In Physical Terms: Historical Data (2012–2025) and Forecast (2026–2035)
    22. Imports, In Value Terms: Historical Data (2012–2025) and Forecast (2026–2035)
    23. Imports, In Physical Terms, By Country, 2025
    24. Imports, In Physical Terms, By Country: Historical Data (2012–2025) and Forecast (2026–2035)
    25. Imports, In Value Terms, By Country: Historical Data (2012–2025) and Forecast (2026–2035)
    26. Import Prices, By Country: Historical Data (2012–2025) and Forecast (2026–2035)
    27. Exports, In Physical Terms: Historical Data (2012–2025) and Forecast (2026–2035)
    28. Exports, In Value Terms: Historical Data (2012–2025) and Forecast (2026–2035)
    29. Exports, In Physical Terms, By Country, 2025
    30. Exports, In Physical Terms, By Country: Historical Data (2012–2025) and Forecast (2026–2035)
    31. Exports, In Value Terms, By Country: Historical Data (2012–2025) and Forecast (2026–2035)
    32. Export Prices, By Country: Historical Data (2012–2025) and Forecast (2026–2035)

Free Training

Source link