

U.S. Manufacturing Boosts Capex Expectations


Written by Danny Levin, Deputy Editor for IIR News Intelligence (Sugar Land, Texas)

Summary

A recent outlook survey indicates U.S. manufacturers expect an increase in capital spending over the next 12 months. Industrial Info Resources project data shows U.S. manufacturing industry construction remains robust.

U.S. Manufacturers Expect More Capex

U.S. manufacturers reported another increase in expected capital expenditures over the next 12 months, based on the latest outlook survey by the National Association of Manufacturers (NAM).

According to Industrial Info Resources data, there is $785 billion worth of capital U.S. Industrial Manufacturing Industry projects under construction, with another $278 billion that could kick off in the fourth quarter.

While not all of those fourth-quarter kickoffs will move forward as planned, IIR data show $117 billion worth of projects kicked off in fourth-quarter 2025.

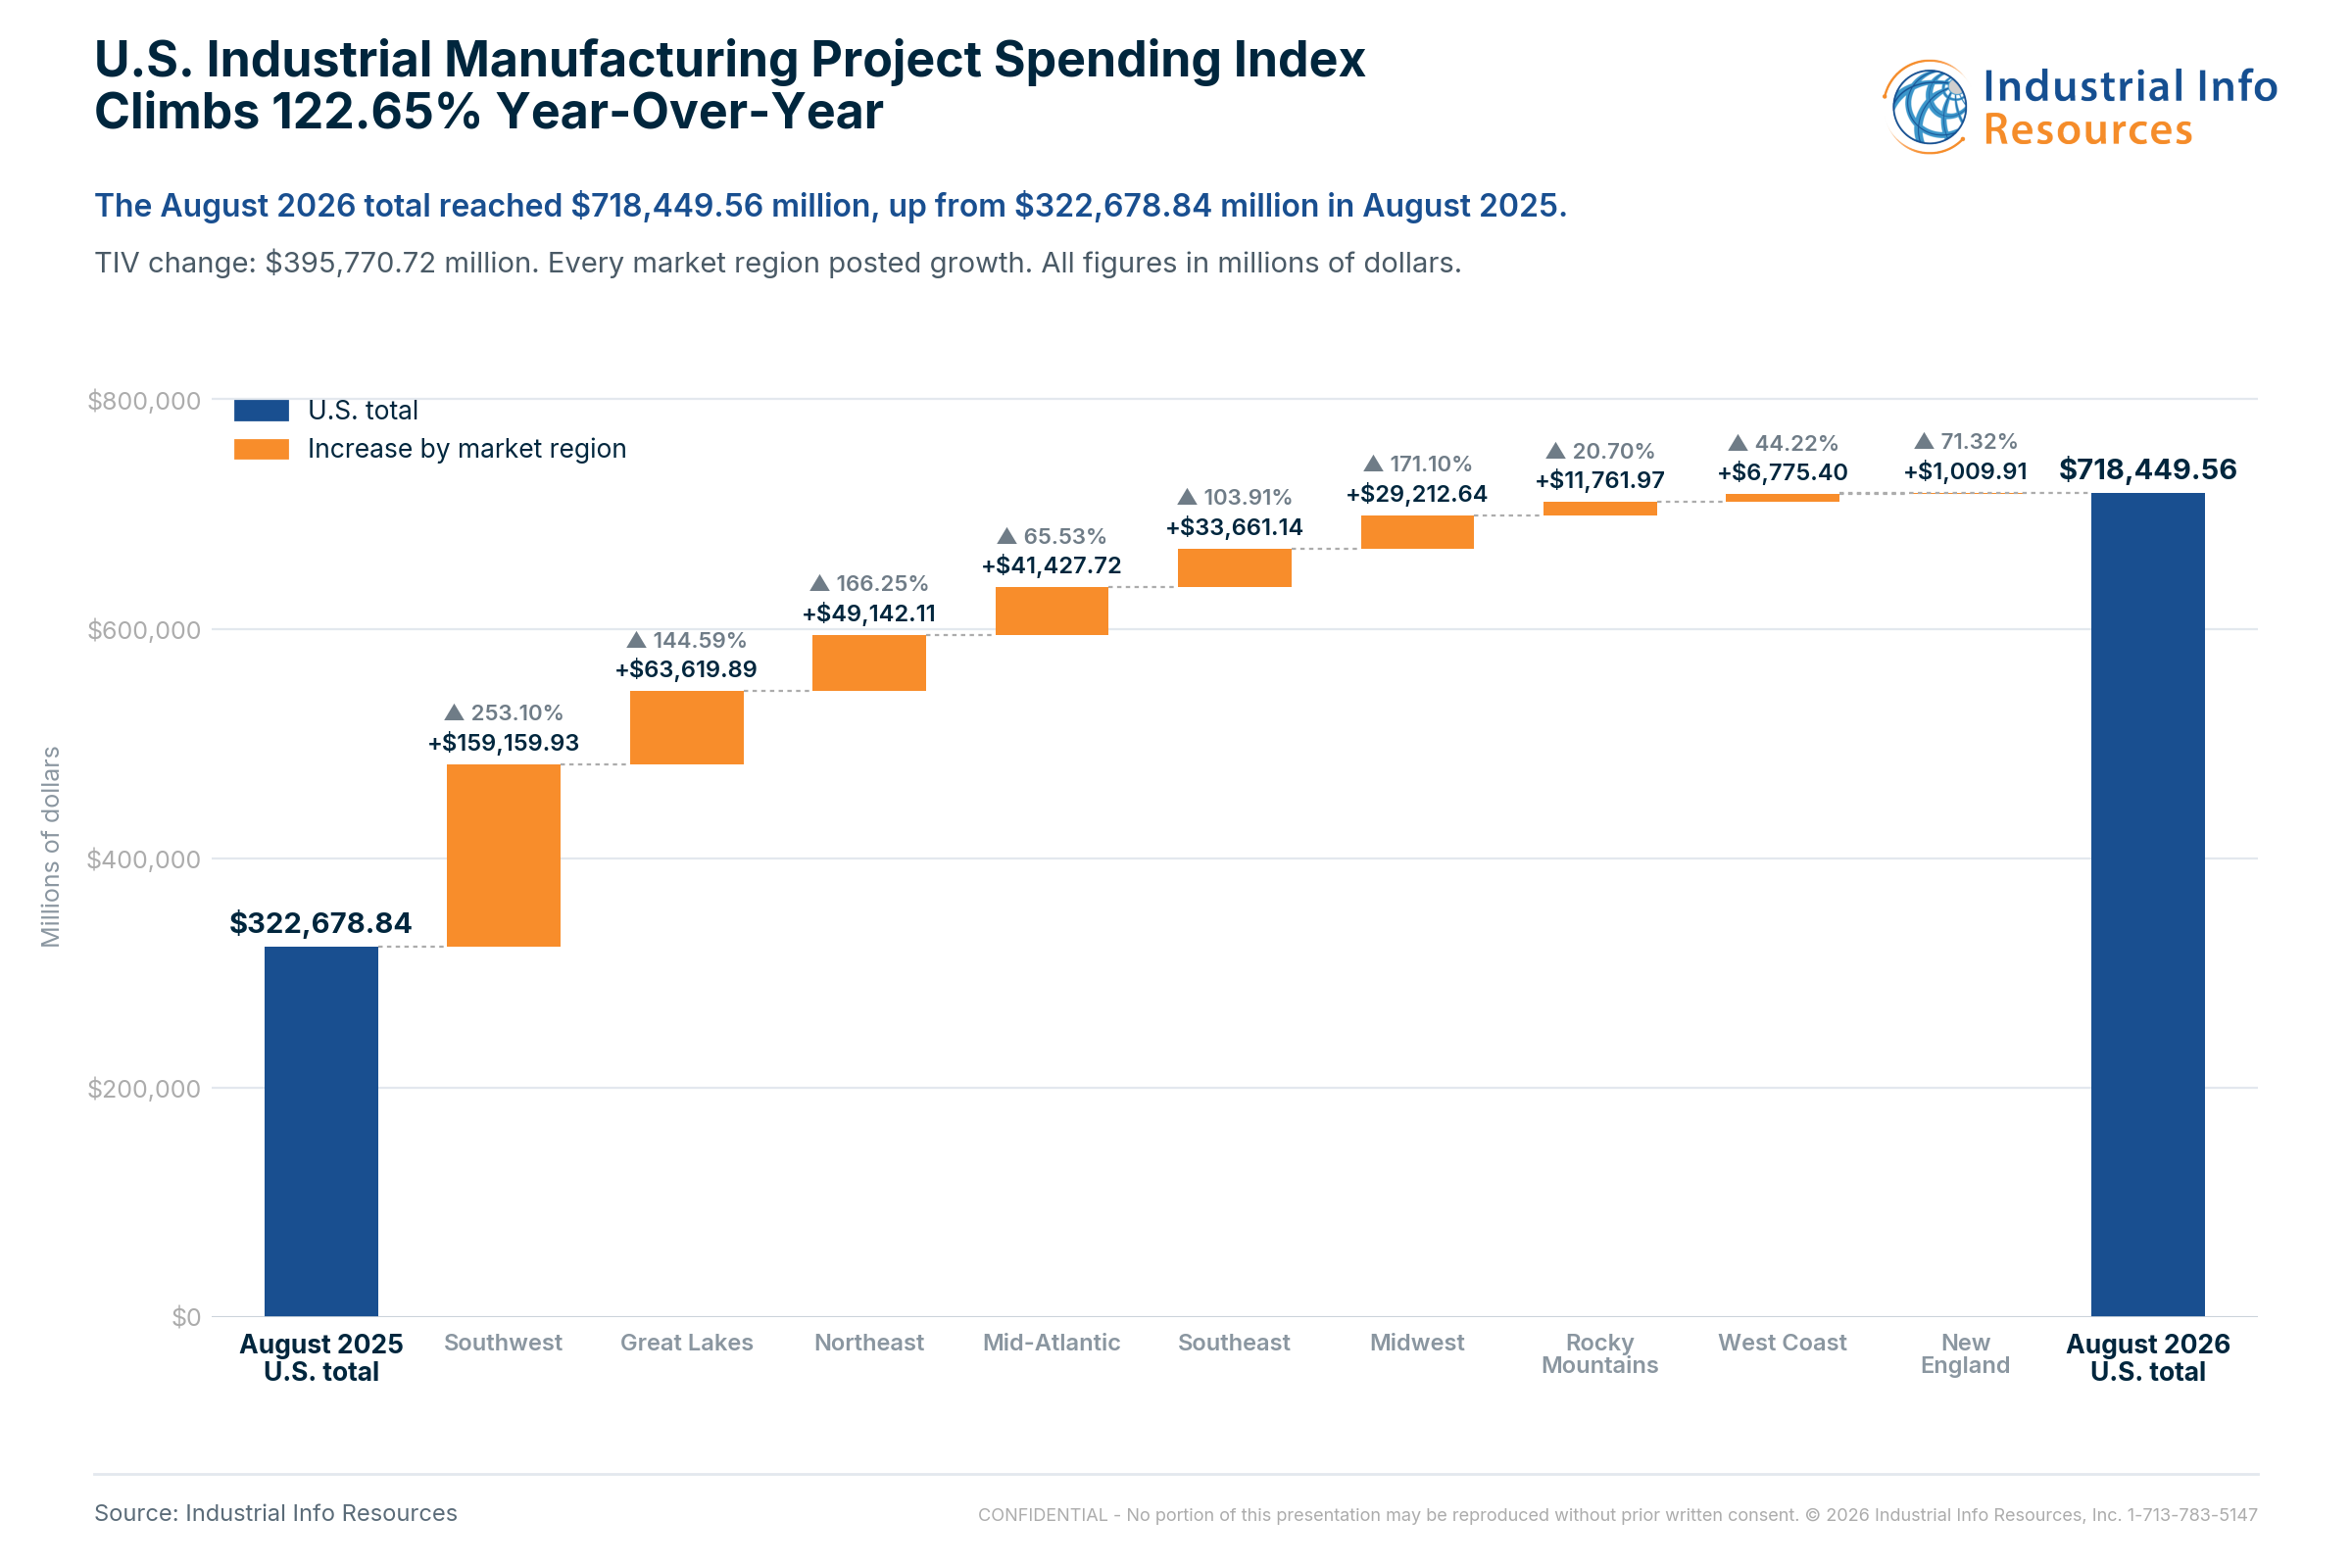
IIR’s North American Industrial Project Spending Index–which tracks both capital and maintenance project activity–for the U.S. Industrial Manufacturing industry also shows strong spending: The monthly index for August (the latest available data) shows project spending was $718.4 billion–up 122.65% from $322.7 billion in August 2025.
Attachment

The NAM survey ran from August 11 to August 27 and received 220 responses, featuring small (those with 49 or less employees), medium-sized (between 50 and 499 employees) and large manufacturers (500 or more employees).

According to the survey results, which were released September 14, respondents anticipated an increase of 2.6% in capital spending over the next 12 months–an increase from 1.8% and 1.7% in the first and second quarters, respectively.

Nearly 50% of the respondents indicated they expected additional capital spending in the next year (up from 37.1% last quarter), with 39.4% predicting no change and 11.3% forecasting reduced capital expenditures. Large firms forecast the highest level of investment, projecting a 2.9% increase over the next 12 months.

On another positive note, the overall sentiment improved to a four-year high: 78.9% of respondents were positive about their own company’s outlook, up 4.7% from the previous quarter.

…But Challenges Remain


The survey respondents reported increased raw material costs as their top business challenge, followed by rising healthcare costs and trade uncertainties (e.g. actual or proposed tariffs, trade negotiations uncertainty).

Respondents anticipate raw material prices and other input costs will rise 5% over the next 12 months, down from 5.8% that was expected in the second quarter. Overall, about 90% expect an increase in raw material costs over the next year, with nearly half anticipating increases exceeding 5%.

The Middle East conflict in particular continues to pose a challenge: “When asked how challenges, such as higher input costs, difficulty sourcing inputs and supply-chain disruptions, arising from the conflict in the Middle East compare to last quarter, nearly one-third (33.2%) said challenges have worsened. At the same time, 60.6% said that challenges were about the same as three months ago, while only 6.2% have seen their situation improve.”

In addition, respondents indicated freight rates and fuel costs are hurting supply chains.

Manufacturing Construction Projects


Data centers play the dominant role in manufacturing projects being tracked by Industrial Info Resources. This includes Amazon Web Services’ ongoing construction of 14 artificial intelligence (AI) data center buildings in New Carlisle, Indiana, alongside 18 operational buildings. Upon full buildout, the overall footprint would span roughly 6.5 million square feet, require 2.25 gigawatts of grid power, and run strictly on Amazon’s proprietary Trainium2 AI chips. The GMI data show the first six buildings out of the new 14 are under construction, with eight subsequent buildings kicking off by the end of 2029.

The Industrial Info Resources Global Market Intelligence (GMI) Industrial Manufacturing Plant and Project databases offer more information–including construction schedules, investment values and necessary equipment–in a plant profile and detailed project reports.

Key Takeaways

  • According to a recent survey, U.S. manufacturers expect capital spending will increase 2.6% over the next 12 months.
  • Challenges for manufacturers stemming from the Middle East conflict have worsened.
  • $785 billion: Total investment value of U.S manufacturing projects under construction.

About Industrial Info Resources
Industrial Info Resources (IIR) is the leading provider of industrial market intelligence. Since 1983, IIR has provided comprehensive research, news and analysis on the industrial process, manufacturing and energy related industries. IIR’s Global Market Intelligence (GMI) helps companies identify and pursue trends across multiple markets with access to real, qualified and validated plant and project opportunities. Across the world, Industrial Info Resources is tracking over 250,000 current and future projects worth $30.2 trillion (USD).


Free Training

Source link

US Manufacturing PMI Slips to 53.2 in August, Missing Expectations | Forex News economic data


BitcoinWorld

US Manufacturing PMI Slips to 53.2 in August, Missing Expectations

The United States S&P Global Manufacturing PMI came in at 53.2 in August, below the expected 53.9 and down from the previous month’s reading, signaling a slowdown in factory activity growth. The data, released by S&P Global, indicates that while the manufacturing sector continues to expand, the pace of growth has moderated more than analysts had anticipated.

What the PMI Reading Means for the Economy

The Purchasing Managers’ Index (PMI) is a key indicator of economic health in the manufacturing sector. A reading above 50 signifies expansion, while below 50 indicates contraction. The August figure of 53.2 still points to growth, but the miss against expectations suggests that manufacturers are facing headwinds such as softer demand, supply chain disruptions, or rising input costs. This slowdown could signal broader economic cooling, which might influence Federal Reserve policy decisions in the coming months.

Market and Industry Reactions

Following the release, financial markets showed muted reaction as investors digested the data alongside other economic indicators. The manufacturing sector has been a bright spot in the U.S. economy, but the latest PMI reading adds to a mixed picture of resilience and vulnerability. Industry analysts note that while the sector remains in expansion territory, the downward trend could prompt businesses to adjust inventory and investment plans.

Why This Matters to You

For consumers, a slowdown in manufacturing can eventually lead to changes in product availability and pricing. For investors, it provides a signal about corporate earnings potential in industrial sectors. Policymakers watch PMI data closely as it helps shape decisions on interest rates and economic stimulus. Understanding these trends helps individuals and businesses make informed financial choices.

Conclusion

The August S&P Global Manufacturing PMI of 53.2, while missing expectations, still indicates expansion in the U.S. manufacturing sector. The moderation in growth, however, warrants attention as it may reflect broader economic challenges. As always, the data will be monitored for trends in the months ahead.

FAQs

Q1: What is the S&P Global Manufacturing PMI?
The S&P Global Manufacturing PMI is a monthly survey-based index that measures the economic health of the manufacturing sector. It tracks new orders, production, employment, supplier deliveries, and inventories.

Q2: Why is a PMI below expectations significant?
A PMI below expectations suggests that the manufacturing sector is growing more slowly than analysts predicted, which can signal broader economic deceleration and influence market sentiment and policy decisions.

Q3: How does the PMI affect the average consumer?
Manufacturing activity influences product availability, pricing, and employment. A slowdown could lead to fewer job opportunities in manufacturing and potential price adjustments for goods.

This post US Manufacturing PMI Slips to 53.2 in August, Missing Expectations first appeared on BitcoinWorld.

Free Training

Source link

US Manufacturing PMI Surges to 55.3 in May 2026, Beating Expectations | Trading Economics – News and Statistics


May 21, 2026

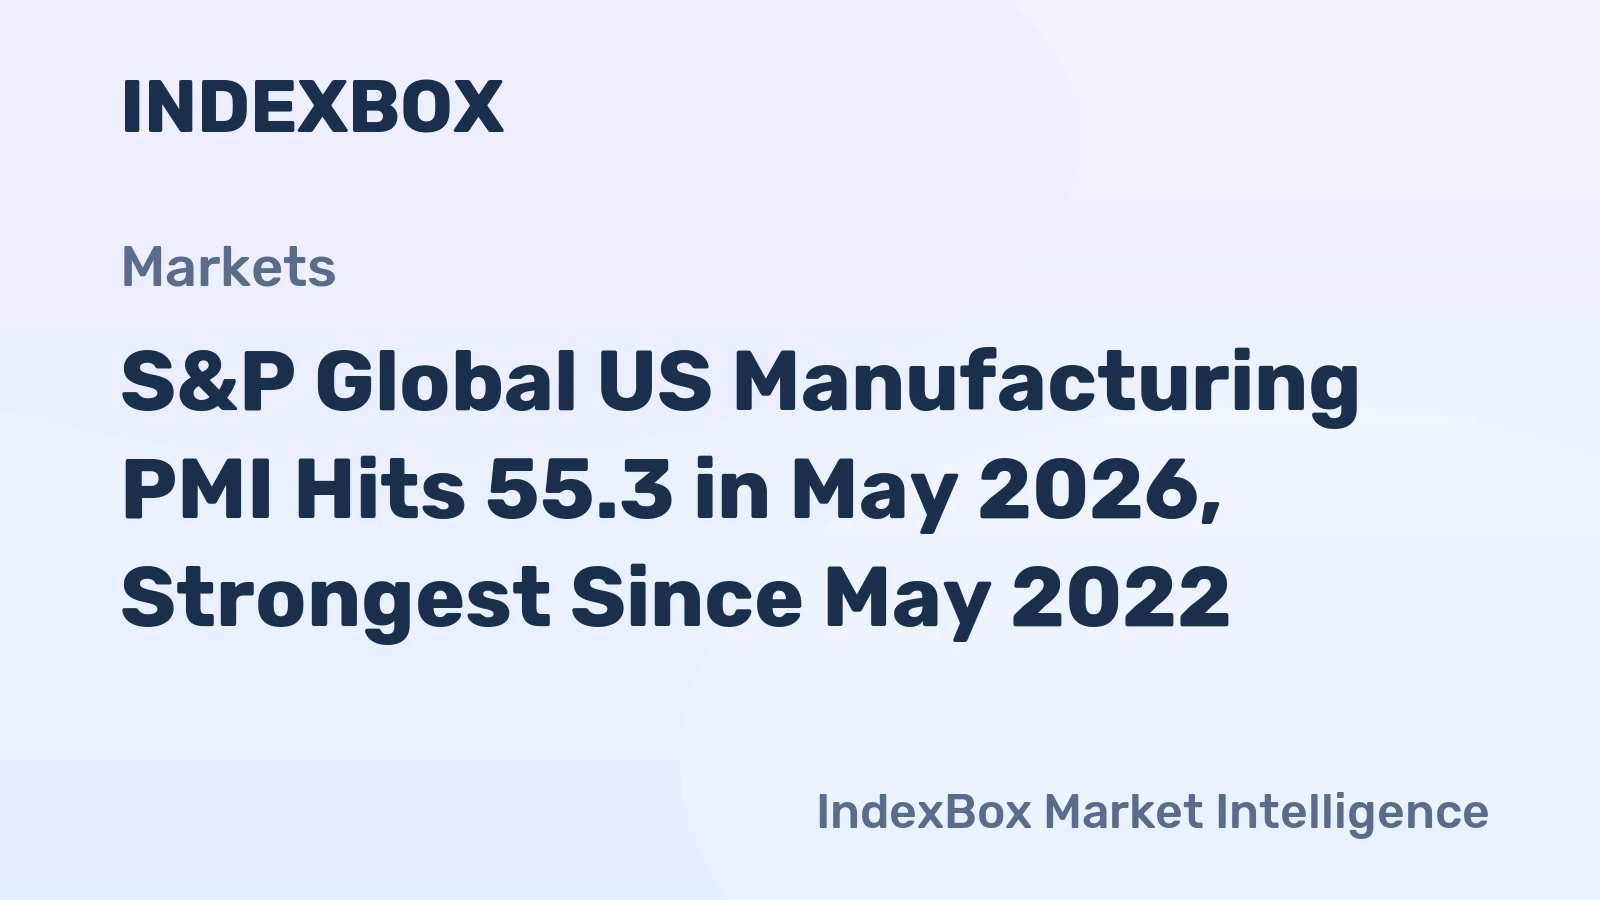
The S&P Global US Manufacturing PMI climbed to 55.3 in May 2026, according to preliminary data from the source, Trading Economics. This reading surpassed the 54.5 recorded in April and exceeded market expectations of 53.8, representing the strongest manufacturing expansion since May 2022. Output grew at the fastest pace in over four years, while job creation reached its highest level since June 2025.

New order growth decelerated but remained the second-strongest in four years, partly supported by clients engaging in precautionary stockpiling due to the Middle East conflict. Input inventories also contributed to the PMI increase, rising at the sharpest rate in 11 months, though this partly reflected safety stock building amid concerns over prices and supply. Supplier delivery times lengthened the most since August 2022.

  1. 1. INTRODUCTION

    Making Data-Driven Decisions to Grow Your Business

    1. REPORT DESCRIPTION
    2. RESEARCH METHODOLOGY AND THE AI PLATFORM
    3. DATA-DRIVEN DECISIONS FOR YOUR BUSINESS
    4. GLOSSARY AND SPECIFIC TERMS
  2. 2. EXECUTIVE SUMMARY

    A Quick Overview of Market Performance

    1. KEY FINDINGS
    2. MARKET TRENDS This Chapter is Available Only for the Professional EditionPRO
  3. 3. MARKET OVERVIEW

    Understanding the Current State of The Market and its Prospects

    1. MARKET SIZE: HISTORICAL DATA (2012–2025) AND FORECAST (2026–2035)
    2. CONSUMPTION BY COUNTRY: HISTORICAL DATA (2012–2025) AND FORECAST (2026–2035)
    3. MARKET FORECAST TO 2035
  4. 4. MOST PROMISING PRODUCTS FOR DIVERSIFICATION

    Finding New Products to Diversify Your Business

    1. TOP PRODUCTS TO DIVERSIFY YOUR BUSINESS
    2. BEST-SELLING PRODUCTS
    3. MOST CONSUMED PRODUCTS
    4. MOST TRADED PRODUCTS
    5. MOST PROFITABLE PRODUCTS FOR EXPORT
  5. 5. MOST PROMISING SUPPLYING COUNTRIES

    Choosing the Best Countries to Establish Your Sustainable Supply Chain

    1. TOP COUNTRIES TO SOURCE YOUR PRODUCT
    2. TOP PRODUCING COUNTRIES
    3. TOP EXPORTING COUNTRIES
    4. LOW-COST EXPORTING COUNTRIES
  6. 6. MOST PROMISING OVERSEAS MARKETS

    Choosing the Best Countries to Boost Your Export

    1. TOP OVERSEAS MARKETS FOR EXPORTING YOUR PRODUCT
    2. TOP CONSUMING MARKETS
    3. UNSATURATED MARKETS
    4. TOP IMPORTING MARKETS
    5. MOST PROFITABLE MARKETS
  7. 7. PRODUCTION

    The Latest Trends and Insights into The Industry

    1. PRODUCTION VOLUME AND VALUE: HISTORICAL DATA (2012–2025) AND FORECAST (2026–2035)
    2. PRODUCTION BY COUNTRY: HISTORICAL DATA (2012–2025) AND FORECAST (2026–2035)
  8. 8. IMPORTS

    The Largest Import Supplying Countries

    1. IMPORTS: HISTORICAL DATA (2012–2025) AND FORECAST (2026–2035)
    2. IMPORTS BY COUNTRY: HISTORICAL DATA (2012–2025) AND FORECAST (2026–2035)
    3. IMPORT PRICES BY COUNTRY: HISTORICAL DATA (2012–2025) AND FORECAST (2026–2035)
  9. 9. EXPORTS

    The Largest Destinations for Exports

    1. EXPORTS: HISTORICAL DATA (2012–2025) AND FORECAST (2026–2035)
    2. EXPORTS BY COUNTRY: HISTORICAL DATA (2012–2025) AND FORECAST (2026–2035)
    3. EXPORT PRICES BY COUNTRY: HISTORICAL DATA (2012–2025) AND FORECAST (2026–2035)
  10. 10. PROFILES OF MAJOR PRODUCERS

    The Largest Producers on The Market and Their Profiles

  11. 11. COUNTRY PROFILES

    The Largest Markets And Their Profiles

    This Chapter is Available Only for the Professional Edition
    PRO

    1. 11.1

      United States

      • Market Size
      • Production
      • Imports
      • Exports
    2. 11.2

      China

      • Market Size
      • Production
      • Imports
      • Exports
    3. 11.3

      Japan

      • Market Size
      • Production
      • Imports
      • Exports
    4. 11.4

      Germany

      • Market Size
      • Production
      • Imports
      • Exports
    5. 11.5

      United Kingdom

      • Market Size
      • Production
      • Imports
      • Exports
    6. 11.6

      France

      • Market Size
      • Production
      • Imports
      • Exports
    7. 11.7

      Brazil

      • Market Size
      • Production
      • Imports
      • Exports
    8. 11.8

      Italy

      • Market Size
      • Production
      • Imports
      • Exports
    9. 11.9

      Russian Federation

      • Market Size
      • Production
      • Imports
      • Exports
    10. 11.10

      India

      • Market Size
      • Production
      • Imports
      • Exports
    11. 11.11

      Canada

      • Market Size
      • Production
      • Imports
      • Exports
    12. 11.12

      Australia

      • Market Size
      • Production
      • Imports
      • Exports
    13. 11.13

      Republic of Korea

      • Market Size
      • Production
      • Imports
      • Exports
    14. 11.14

      Spain

      • Market Size
      • Production
      • Imports
      • Exports
    15. 11.15

      Mexico

      • Market Size
      • Production
      • Imports
      • Exports
    16. 11.16

      Indonesia

      • Market Size
      • Production
      • Imports
      • Exports
    17. 11.17

      Netherlands

      • Market Size
      • Production
      • Imports
      • Exports
    18. 11.18

      Turkey

      • Market Size
      • Production
      • Imports
      • Exports
    19. 11.19

      Saudi Arabia

      • Market Size
      • Production
      • Imports
      • Exports
    20. 11.20

      Switzerland

      • Market Size
      • Production
      • Imports
      • Exports
    21. 11.21

      Sweden

      • Market Size
      • Production
      • Imports
      • Exports
    22. 11.22

      Nigeria

      • Market Size
      • Production
      • Imports
      • Exports
    23. 11.23

      Poland

      • Market Size
      • Production
      • Imports
      • Exports
    24. 11.24

      Belgium

      • Market Size
      • Production
      • Imports
      • Exports
    25. 11.25

      Argentina

      • Market Size
      • Production
      • Imports
      • Exports
    26. 11.26

      Norway

      • Market Size
      • Production
      • Imports
      • Exports
    27. 11.27

      Austria

      • Market Size
      • Production
      • Imports
      • Exports
    28. 11.28

      Thailand

      • Market Size
      • Production
      • Imports
      • Exports
    29. 11.29

      United Arab Emirates

      • Market Size
      • Production
      • Imports
      • Exports
    30. 11.30

      Colombia

      • Market Size
      • Production
      • Imports
      • Exports
    31. 11.31

      Denmark

      • Market Size
      • Production
      • Imports
      • Exports
    32. 11.32

      South Africa

      • Market Size
      • Production
      • Imports
      • Exports
    33. 11.33

      Malaysia

      • Market Size
      • Production
      • Imports
      • Exports
    34. 11.34

      Israel

      • Market Size
      • Production
      • Imports
      • Exports
    35. 11.35

      Singapore

      • Market Size
      • Production
      • Imports
      • Exports
    36. 11.36

      Egypt

      • Market Size
      • Production
      • Imports
      • Exports
    37. 11.37

      Philippines

      • Market Size
      • Production
      • Imports
      • Exports
    38. 11.38

      Finland

      • Market Size
      • Production
      • Imports
      • Exports
    39. 11.39

      Chile

      • Market Size
      • Production
      • Imports
      • Exports
    40. 11.40

      Ireland

      • Market Size
      • Production
      • Imports
      • Exports
    41. 11.41

      Pakistan

      • Market Size
      • Production
      • Imports
      • Exports
    42. 11.42

      Greece

      • Market Size
      • Production
      • Imports
      • Exports
    43. 11.43

      Portugal

      • Market Size
      • Production
      • Imports
      • Exports
    44. 11.44

      Kazakhstan

      • Market Size
      • Production
      • Imports
      • Exports
    45. 11.45

      Algeria

      • Market Size
      • Production
      • Imports
      • Exports
    46. 11.46

      Czech Republic

      • Market Size
      • Production
      • Imports
      • Exports
    47. 11.47

      Qatar

      • Market Size
      • Production
      • Imports
      • Exports
    48. 11.48

      Peru

      • Market Size
      • Production
      • Imports
      • Exports
    49. 11.49

      Romania

      • Market Size
      • Production
      • Imports
      • Exports
    50. 11.50

      Vietnam

      • Market Size
      • Production
      • Imports
      • Exports
  12. LIST OF TABLES

    1. Key Findings In 2025
    2. Market Volume, In Physical Terms: Historical Data (2012–2025) and Forecast (2026–2035)
    3. Market Value: Historical Data (2012–2025) and Forecast (2026–2035)
    4. Per Capita Consumption, by Country, 2022–2025
    5. Production, In Physical Terms, By Country: Historical Data (2012–2025) and Forecast (2026–2035)
    6. Imports, In Physical Terms, By Country: Historical Data (2012–2025) and Forecast (2026–2035)
    7. Imports, In Value Terms, By Country: Historical Data (2012–2025) and Forecast (2026–2035)
    8. Import Prices, By Country: Historical Data (2012–2025) and Forecast (2026–2035)
    9. Exports, In Physical Terms, By Country: Historical Data (2012–2025) and Forecast (2026–2035)
    10. Exports, In Value Terms, By Country: Historical Data (2012–2025) and Forecast (2026–2035)
    11. Export Prices, By Country: Historical Data (2012–2025) and Forecast (2026–2035)
  13. LIST OF FIGURES

    1. Market Volume, In Physical Terms: Historical Data (2012–2025) and Forecast (2026–2035)
    2. Market Value: Historical Data (2012–2025) and Forecast (2026–2035)
    3. Consumption, by Country, 2025
    4. Market Volume Forecast to 2035
    5. Market Value Forecast to 2035
    6. Market Size and Growth, By Product
    7. Average Per Capita Consumption, By Product
    8. Exports and Growth, By Product
    9. Export Prices and Growth, By Product
    10. Production Volume and Growth
    11. Exports and Growth
    12. Export Prices and Growth
    13. Market Size and Growth
    14. Per Capita Consumption
    15. Imports and Growth
    16. Import Prices
    17. Production, In Physical Terms: Historical Data (2012–2025) and Forecast (2026–2035)
    18. Production, In Value Terms: Historical Data (2012–2025) and Forecast (2026–2035)
    19. Production, by Country, 2025
    20. Production, In Physical Terms, by Country: Historical Data (2012–2025) and Forecast (2026–2035)
    21. Imports, In Physical Terms: Historical Data (2012–2025) and Forecast (2026–2035)
    22. Imports, In Value Terms: Historical Data (2012–2025) and Forecast (2026–2035)
    23. Imports, In Physical Terms, By Country, 2025
    24. Imports, In Physical Terms, By Country: Historical Data (2012–2025) and Forecast (2026–2035)
    25. Imports, In Value Terms, By Country: Historical Data (2012–2025) and Forecast (2026–2035)
    26. Import Prices, By Country: Historical Data (2012–2025) and Forecast (2026–2035)
    27. Exports, In Physical Terms: Historical Data (2012–2025) and Forecast (2026–2035)
    28. Exports, In Value Terms: Historical Data (2012–2025) and Forecast (2026–2035)
    29. Exports, In Physical Terms, By Country, 2025
    30. Exports, In Physical Terms, By Country: Historical Data (2012–2025) and Forecast (2026–2035)
    31. Exports, In Value Terms, By Country: Historical Data (2012–2025) and Forecast (2026–2035)
    32. Export Prices, By Country: Historical Data (2012–2025) and Forecast (2026–2035)

Free Training

Source link