Indiana manufacturing push and acquisition drive keep focus on


Eli Lilly & Co. shares on the NYSE traded above USD 1,060 on 06/03/2026 as the United States-based pharma group steps up a multibillion-dollar manufacturing expansion in Indiana and signals a more aggressive acquisition strategy for its drug pipeline.

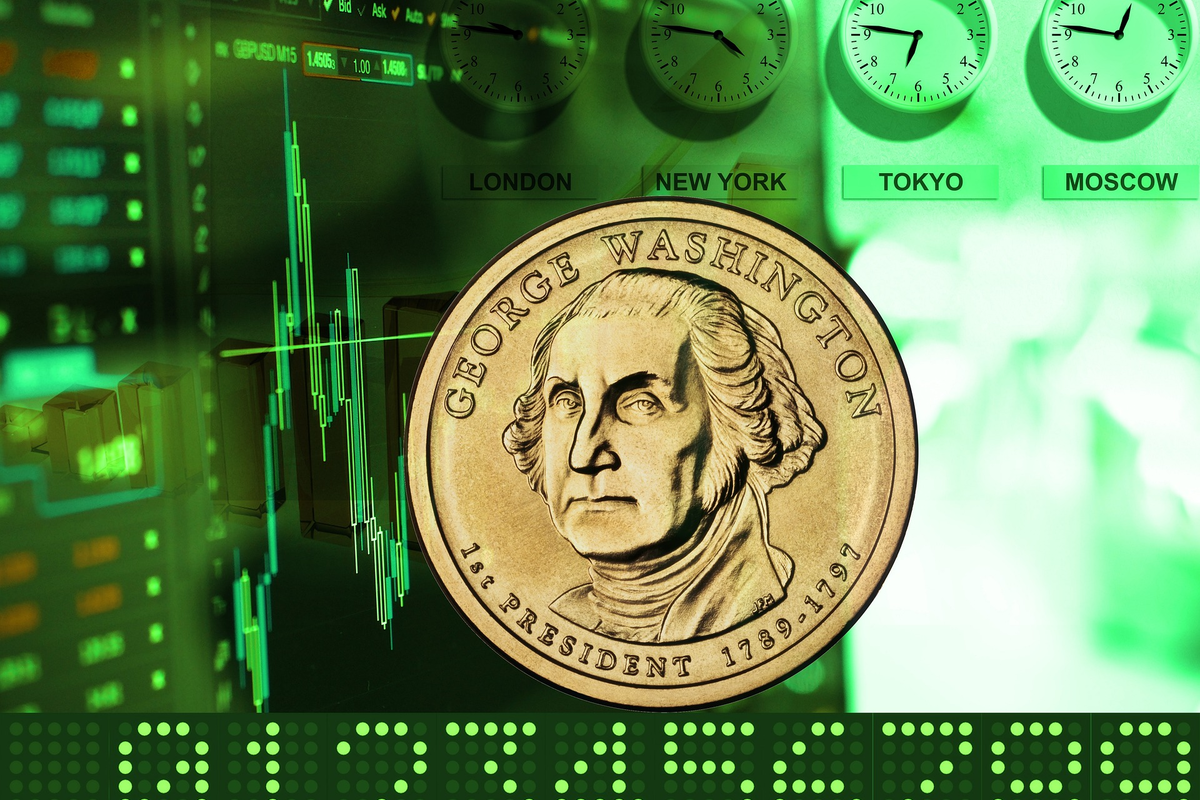
Eli Lilly & Co. shares remain in focus on the New York Stock Exchange as investors digest the latest signals on the United States company’s capital deployment, combining large-scale manufacturing investments in Indiana with an expanded acquisition strategy to bolster its portfolio of innovative medicines. The stock traded around USD 1,064 on 06/03/2026 on the NYSE under the ticker LLY, according to data cited by GuruFocus as of 06/03/2026, keeping the United States blue chip firmly among the largest healthcare names by market capitalization.

The Indianapolis-based group has been pushing ahead with a sizable expansion of its domestic production base. According to an article published by Manufacturing in Focus on 06/2026, Eli Lilly is topping out its Indiana investment by allocating an additional USD 4.5 billion to its manufacturing footprint in the state, building on earlier commitments to facilities including its LEAP Research and Innovation District near Indianapolis. The report highlights that the expansion is intended to support growing demand for the company’s diabetes and obesity treatments and other biologic therapies, while anchoring high-value pharmaceutical manufacturing in the United States.

Parallel to this capital expenditure program, management has also been signaling a more assertive approach to business development. On 06/03/2026, GuruFocus reported that Eli Lilly’s oncology dealmaker Jacob Van Naarden is leading a significant ramp-up in acquisitions, with more than USD 10 billion of deals already announced in 2026 to acquire or partner with smaller biotech innovators. The article notes that across eight transactions this year, the company has committed over USD 10 billion upfront and potentially up to USD 25 billion when including milestone payments, as it targets cutting-edge assets in oncology and other high-growth therapeutic areas.

The same GuruFocus analysis calculates a proprietary GF Value of USD 1,388.64 per share for Eli Lilly as of 06/03/2026 versus a contemporaneous share price of about USD 1,064.15, implying the stock was trading at roughly a 23.4 percent discount to that intrinsic value estimate. While this is not a market consensus, it illustrates how one valuation framework interprets the company’s growth trajectory, pipeline prospects, and balance sheet strength at the current trading level on the NYSE. For German investors accessing the stock via off-exchange platforms, Eli Lilly is also tradeable on venues such as Tradegate in euros, although liquidity and reference pricing remain centered on the US listing.

Interest from institutional investors continues to underpin trading in the United States. According to a MarketBeat filing summary dated 06/03/2026, Westpac Banking Corp increased its position in Eli Lilly by 39.5 percent in the fourth quarter, purchasing 4,030 additional shares and bringing its total holdings to 14,235 shares. The disclosure underscores how large global asset managers are still adding exposure to the group, with the same MarketBeat overview citing a consensus rating of “Moderate Buy” and an average price target of USD 1,227 among covering analysts as of the latest data. These figures provide a snapshot of how the sell side is framing upside and risk for the stock at current levels.

The combination of escalation in US-based manufacturing investment and heightened acquisition activity is central to how the market evaluates Eli Lilly’s growth case. Investors are paying close attention to whether the expanded Indiana production network will effectively support supply for high-demand medicines, and how quickly newly acquired pipeline assets can be integrated and advanced through clinical trials and regulatory review. With the company’s primary listing and regulatory reporting anchored in the United States, updates via NYSE trading data and SEC filings will remain key reference points for both domestic and international shareholders following the stock.

As of: 06/03/2026

By the editorial team – specialized in equity coverage.

At a glance

  • Name: Eli Lilly & Co.
  • Sector/industry: Pharmaceuticals and biotechnology
  • Headquarters/country: Indianapolis, United States
  • Core markets: United States, Europe, key international pharmaceutical markets
  • Key revenue drivers: Diabetes and obesity therapies, immunology and oncology drugs, other specialty pharmaceuticals
  • Home exchange/listing venue: New York Stock Exchange (LLY)
  • Trading currency: USD

Eli Lilly & Co.: core business model

Eli Lilly focuses on discovering, developing, and commercializing branded prescription medicines, with revenue concentrated in chronic disease areas such as diabetes, obesity, immunology, and oncology that can support long product lifecycles and premium pricing.

Eli Lilly & Co. in peer comparison

In the global large-cap pharmaceutical space, Eli Lilly is often assessed alongside peers such as Novo Nordisk, Pfizer, and Johnson & Johnson, which likewise operate diversified portfolios of patented therapies and vaccines. Novo Nordisk, for example, has also invested heavily in obesity and diabetes medicines and reached a market capitalization above USD 500 billion in early 2026 on the back of demand for GLP-1-based treatments, underlining the scale of the metabolic disease opportunity for sector leaders. Pfizer, by contrast, has been reallocating cash flows from its COVID-19 franchise into pipeline rebuilds and bolt-on acquisitions, while Johnson & Johnson maintains a more diversified business that includes medical devices and consumer health in addition to pharmaceuticals.

Compared with these peers, Eli Lilly’s current strategy of combining substantial US manufacturing commitments in Indiana with an enlarged acquisition budget exceeding USD 10 billion in 2026 places it toward the more aggressive end of the spectrum in terms of reinvesting cash into long-term growth initiatives. Investors monitoring the stock on the NYSE and in European trading are therefore weighing similar questions across the peer group: how quickly new metabolic and oncology products can be scaled, how effectively supply chains can keep pace with demand, and whether the balance between shareholder returns and reinvestment supports sustainable earnings growth.

Sentiment and reactions on Eli Lilly & Co.

The combination of expanded Indiana manufacturing investment and a more active acquisition pipeline has sparked ongoing discussion among market participants on social platforms about how these moves might influence Eli Lilly & Co.’s long-term earnings power and valuation.

YouTubeXTikTokInstagram

Conclusion

Eli Lilly & Co. remains a closely watched United States healthcare stock, with its NYSE-listed shares trading just above USD 1,060 on 06/03/2026 as the group deploys capital into an expanded Indiana manufacturing footprint and a stepped-up acquisition agenda. The latest reports on more than USD 10 billion of 2026 dealmaking and an additional USD 4.5 billion in state-side plant investment highlight the company’s decision to prioritize future capacity and pipeline breadth alongside ongoing shareholder returns.

For investors comparing Eli Lilly & Co. with global pharma peers such as Novo Nordisk, Pfizer, and Johnson & Johnson, the current strategy underscores a distinct emphasis on scaling high-demand metabolic and oncology therapies through both organic infrastructure builds and external innovation sourcing. How effectively these initiatives translate into sustained revenue and earnings growth over the medium term will remain central to how the stock is valued on the New York Stock Exchange and in secondary trading venues worldwide.

Disclaimer: This article does not constitute investment advice. The comprehensive scope of this informative article was made possible through the use of a.i.. Stocks are volatile financial instruments.


en | US5324571083 | ELI LILLY & CO. | boerse | 69478848 | bgmi


Free Training

Source link

Canadian Solar Resets Focus On U.S. Manufacturing And Margin Quality


  • Canadian Solar (NasdaqGS: CSIQ) has appointed Colin Parkin as CEO, with founder Shawn Qu shifting to Executive Chairman and CTO.
  • The company is reorienting its business toward value driven growth and profitability instead of pure volume expansion.
  • Canadian Solar has begun trial production at its new HJT solar cell factory in Indiana and expanded module capacity in Texas to build out its U.S. manufacturing base.

For you as an investor, this marks a key moment for one of the largest solar and storage players, as Canadian Solar (NasdaqGS: CSIQ) refocuses on higher value markets and products. The move into U.S. manufacturing comes as policy support, supply chain concerns, and local content requirements shape how solar capacity is built and sourced.

The leadership change and U.S. build out indicate where management wants the business to be positioned in the coming years, with more emphasis on technology and margin quality. How effectively the company executes on these priorities, and manages the costs of new factories, will likely be central to how the stock is viewed by investors over time.

Stay updated on the most important news stories for Canadian Solar by adding it to your watchlist or portfolio. Alternatively, explore our Community to discover new perspectives on Canadian Solar.

NasdaqGS:CSIQ 1-Year Stock Price ChartNasdaqGS:CSIQ 1-Year Stock Price Chart

Does the team leading Canadian Solar have what it takes? See our full breakdown of the management team’s track record and compensation.

Investor Checklist

Quick Assessment

  • ⚖️ Price vs Analyst Target: The US$17.88 share price sits very close to the US$18.20 analyst target, suggesting limited implied upside from consensus right now.
  • ✅ Simply Wall St Valuation: Shares are described as trading about 53% below estimated fair value, which flags a potential valuation gap to investigate.
  • ✅ Recent Momentum: The stock is up 37.8% over the last 30 days, showing strong short term interest ahead of the leadership transition and U.S. manufacturing push.

There is only one way to know the right time to buy, sell or hold Canadian Solar. Head to Simply Wall St’s
company report for the latest analysis of Canadian Solar’s Fair Value.

Key Considerations

  • 📊 The shift toward higher value markets and U.S. manufacturing focuses attention on margins and product mix rather than pure shipment growth.
  • 📊 Watch how factory ramp up costs, U.S. policy incentives, and any updates to earnings forecasts line up with the current valuation discount and recent price move.
  • ⚠️ One flagged major risk is that interest payments are not well covered by earnings, so it is important to consider this capex heavy push alongside the balance sheet.

Dig Deeper

For the full picture including more risks and rewards, check out the
complete Canadian Solar analysis. Alternatively, you can check out the
community page for Canadian Solar to see how other investors believe this latest news will impact the company’s narrative.

This article by Simply Wall St is general in nature. We provide commentary based on historical data
and analyst forecasts only using an unbiased methodology and our articles are not intended to be financial advice.
It does not constitute a recommendation to buy or sell any stock, and does not take account of your objectives, or your
financial situation. We aim to bring you long-term focused analysis driven by fundamental data.
Note that our analysis may not factor in the latest price-sensitive company announcements or qualitative material.
Simply Wall St has no position in any stocks mentioned.

New: AI Stock Screener & Alerts

Our new AI Stock Screener scans the market every day to uncover opportunities.

• Dividend Powerhouses (3%+ Yield)
• Undervalued Small Caps with Insider Buying
• High growth Tech and AI Companies

Or build your own from over 50 metrics.

Explore Now for Free

Have feedback on this article? Concerned about the content? Get in touch with us directly. Alternatively, email editorial-team@simplywallst.com

Free Training

Source link

U.S. manufacturing push and Q1 2026 results in focus


Amgen Inc. has announced a fresh $300 million U.S. manufacturing investment and reported first?quarter 2026 financial results, highlighting growth in product sales and margins.

Amgen Inc. has moved into the spotlight after announcing an additional $300 million investment in its U.S. manufacturing network and releasing its first?quarter 2026 financial results. The new capital commitment brings the company’s total U.S. manufacturing outlay over the past year to nearly $2 billion, underscoring its focus on domestic capacity and next?generation biologics production. At the same time, Amgen’s latest quarterly figures show continued revenue growth and solid profitability, reinforcing its position as a leading biotech player for U.S. investors.

According to a press release dated May 4, 2026, Amgen plans to allocate the $300 million to expand and modernize its U.S. manufacturing footprint, including advanced technologies and supply?chain resilience for key medicines. The company emphasized that the investment will support a reliable supply of therapies for patients and align with broader U.S. policy goals around onshoring critical drug production. PR Newswire as of May 4, 2026

On the financial side, Amgen reported first?quarter 2026 results on April 24, 2026, with product sales and overall revenue trending higher year?over?year. Earlier filings and third?party summaries indicate that the company’s quarterly revenue rose about 5.8% versus the same quarter of the prior year, while net margin and return on equity remained strong, reflecting disciplined cost management and pricing power in its core franchises. Stock Titan as of April 24, 2026

As of: 09.05.2026

By the editorial team – specialized in equity coverage.

At a glance

  • Name: Amgen Inc.
  • Sector/industry: Biotechnology / Pharmaceuticals
  • Headquarters/country: Thousand Oaks, California, United States
  • Core markets: United States, Europe, Japan and other developed markets
  • Key revenue drivers: Oncology, cardiovascular, inflammation and bone health franchises
  • Home exchange/listing venue: Nasdaq (ticker: AMGN)
  • Trading currency: U.S. dollar

Amgen Inc.: core business model

Amgen Inc. operates as a global biotechnology company focused on discovering, developing and commercializing innovative human therapeutics. The firm’s business model centers on proprietary biologic platforms and a diversified portfolio of marketed medicines, primarily in oncology, cardiovascular disease, inflammation and bone health. By investing heavily in research and development, Amgen aims to extend the lifecycle of existing products while advancing a pipeline of novel candidates that can address unmet medical needs.

Amgen’s strategy combines internal R&D with targeted acquisitions and collaborations, allowing it to broaden its therapeutic footprint without over?relying on any single indication. The company markets its products through a global commercial infrastructure, with a particularly strong presence in the United States, where it benefits from favorable reimbursement dynamics and a large patient base. This U.S.?centric exposure makes Amgen a relevant name for American retail investors seeking exposure to the biotech sector.

Main revenue and product drivers for Amgen Inc.

Amgen’s revenue is driven by a portfolio of established biologic brands, including therapies for cancer, cardiovascular risk reduction, inflammatory conditions and osteoporosis. These products typically command premium pricing and benefit from long?term treatment regimens, which support recurring sales and relatively predictable cash flows. Recent quarterly filings indicate that product sales have grown steadily, with total revenues rising to about $9.56 billion in the third quarter of 2025 from $8.50 billion a year earlier, reflecting both volume growth and favorable pricing dynamics. Stock Titan as of November 4, 2025

Within this portfolio, oncology and cardiovascular franchises have been key growth engines, supported by label expansions and new indications. Amgen’s ability to maintain high net margins and strong return on equity suggests effective cost control and pricing power, even as the company continues to invest in R&D and manufacturing. The additional $300 million U.S. manufacturing investment announced in May 2026 is expected to further strengthen supply reliability and operational efficiency, which can help protect margins and support long?term revenue growth.

Conclusion

Amgen Inc. is drawing attention from U.S. investors following a fresh $300 million U.S. manufacturing investment and solid first?quarter 2026 financial results. The company’s focus on expanding domestic production capacity aligns with broader policy trends and may enhance supply reliability for its key medicines. At the same time, continued revenue growth and strong profitability metrics suggest that Amgen’s core franchises remain resilient in a competitive biotech landscape.

For U.S. retail investors, Amgen offers exposure to a diversified biotech portfolio with significant domestic sales and a track record of disciplined capital allocation. However, the stock remains sensitive to regulatory developments, pricing pressures and pipeline execution, which can influence both near?term performance and long?term growth prospects. As with any equity, investors should weigh these factors carefully and consider their own risk tolerance before making decisions.

Disclaimer: This article does not constitute investment advice. Stocks are volatile financial instruments.


en | US0311621009 | AMGEN INC. | boerse | 69298087 | bgmi

Free Training

Source link