235 new clean energy factories opened in 5 years as a US manufacturing boom powers through policy headwinds


235 new clean energy factories opened in 5 years as a US manufacturing boom powers through policy headwinds Photo Credit: iStock

America’s clean energy manufacturing boom is still gaining speed — even as tariffs and broader policy uncertainty hang over the sector.

According to SolarQuarter, a new industry report said the United States added more than 235 clean energy factories in just five years, with domestic production emerging as a major force in both the economy and the energy transition.

What’s happening?

The American Clean Power Association’s second annual State of Clean Energy Manufacturing said the sector has grown rapidly.

In addition to the new clean energy manufacturing facilities, the report found that U.S. production capacity is sufficient to meet domestic demand for solar modules, battery modules, wind towers, and wind nacelles. That marks a major shift for an industry that has long depended on overseas supply chains.

Jason Grumet, CEO of the American Clean Power Association, said the surge is especially important amid rising energy demand, per SolarQuarter. But he also cautioned that sustaining the momentum will require clear, targeted, and consistent trade policy, along with realistic timelines for tariff compliance and greater regulatory certainty.

Why does it matter?

More domestic clean energy manufacturing can help make the electrical grid more reliable, reduce dependence on foreign supply chains, and support the faster deployment of renewable power sources (such as wind and solar) that can lower energy costs over time.

The report also found that each clean energy manufacturing job supports four additional jobs across the broader economy — one linked to suppliers and three tied to household spending.

As U.S. manufacturing expands, technologies like solar panels and batteries may become more accessible.

What are people saying?

Grumet said that as energy demand rises, the U.S. needs more clean power systems built at home.

The ACPA report points to factory growth, domestic manufacturing strength, and the sector’s ripple effects on jobs and local economies.

Even with policy headwinds, clean energy manufacturing can become a cornerstone of American industry.

Get TCD’s free newsletters for easy tips, smart advice, and a chance to earn $5,000 toward home upgrades. To see more stories like this one, change your Google preferences here.

Free Training

Source link

The U.S. will have more than 950 clean energy manufacturing facilities by 2030: report


A report from the American Clean Power Association (ACP) examines the breadth and impact of the clean energy manufacturing sector in the United States.

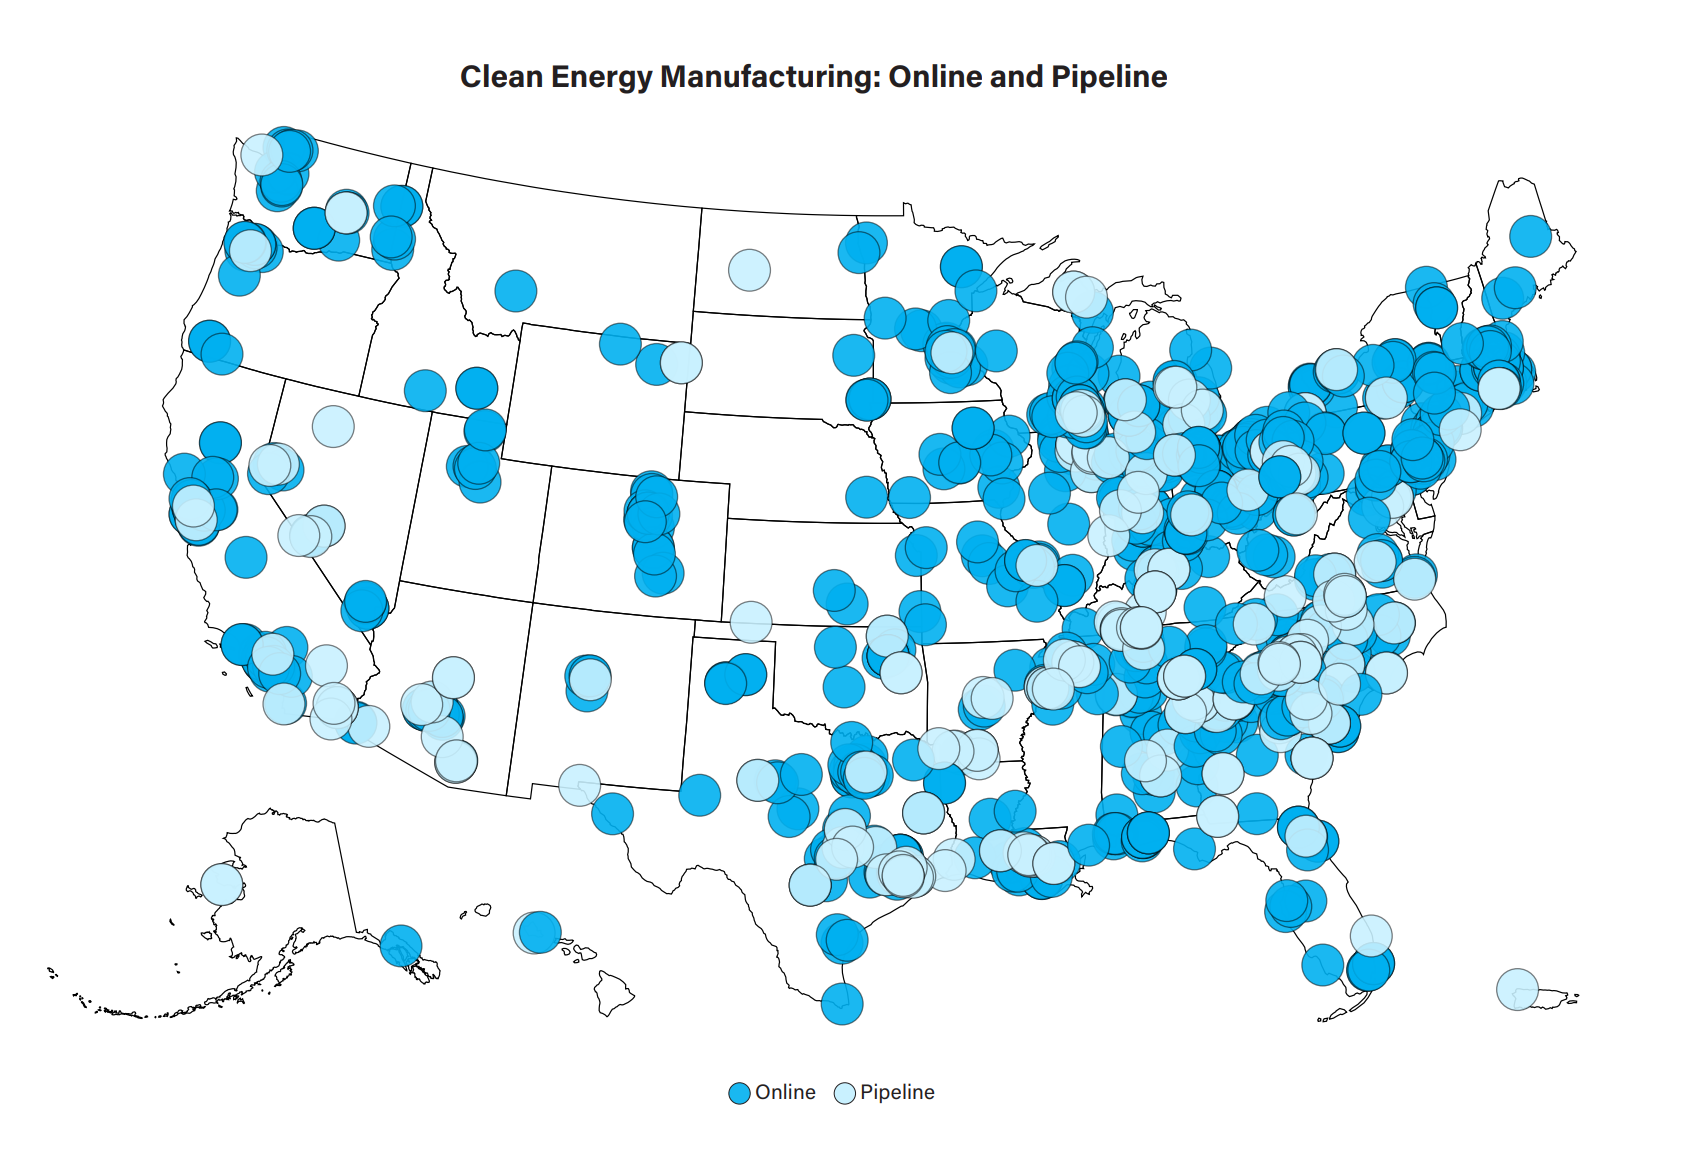
The report, called America Builds Power: The State of Clean Energy Manufacturing in 2026, covers 825 currently-active manufacturing facilities in all 50 states. The researchers identified 50,000 direct workers at the facilities, who make average salaries 35% greater than the national average. 

In addition to direct employment, the report states 50,000 jobs have been created to support upstream activities related to clean energy manufacturing activity, alongside nearly 107,000 jobs generated based on household spending by the original workers (induced jobs). 

Added together, the ACP says the total effective employment impact of clean energy manufacturing is 215,700 jobs, with 106,100 accounted for by solar manufacturing, 53,100 from energy storage manufacturing and 56,500 from wind.

In addition to employment related to operation and economic activity from the manufacturing facilities, the report outlines the impact of facility construction. The ACP finds that construction of new or expanded clean energy manufacturing facilities in 2025 supported 207,000 jobs and led to over $20 billion in increased GDP.

The top states by total GDP from clean energy component manufacturing include Texas, where much of the newest solar module capacity has been built, Michigan and Illinois, in which LFP battery cell manufacturing is king, Ohio, home of First Solar’s largest thin-film production facilities, and Georgia, where Qcells operates a vertically-integrated ingot-to-module manufacturing hub.

Looking toward the future

Chart showing existing and expected manufacturing capacity for solar modules and cells, battery modules and cells, and wind energy nacelles and towers.

By 2030, the ACP expects the number of jobs due to solar manufacturing to grow by more than 63,000, with annual solar module production capability ramping from 63 GW at the end of 2025 to over 85 GW by the end of the decade, with solar cell production capacity rising to about half that of modules.

The numbers for future energy storage manufacturing-related jobs are even higher, expected to grow by over 91,000 as battery module manufacturing capacity doubles from 75 to more than 150 GWh, and domestic LFP cell capacity jumps to over 130 GWh by 2030. Similarly huge increases are expected in the domestic production of anode and cathode materials and lithium processing.

Increases in the production capacity of and employment related to wind energy manufacturing are projected to increase by small amounts, with an estimated 2,400 new jobs expected through 2030. The relatively small predicted increases are due to current domestic production capacity already exceeding demand, with only slow growth expected in that demand.

Upcoming events

The topics covered in the ACP report echo those that will be explored in two upcoming events from pv magazine USA

The first of these events is Solar Manufacturing USA 2026, a live conference co-organized with Finaly Colville of Terawatt PV Research, to be held at the AT&T Hotel and Conference Center in Austin, Texas on September 22 and 23, 2026. 

Solar Manufacturing USA event banner

Representatives from companies throughout the domestic solar and energy storage supply chains will gather for networking events and sessions related to technology, facility construction, operations, procurement and materials sourcing. 

Current partners include T1 Energy, SEG Solar and Talon PV. Attendees are expected to include CTOs, heads of R&D, manufacturing and operations leaders, procurement teams, commercial and strategy executives, and specialists involved in supply-chain, quality and market-entry decisions.

USA Week 2026 event banner

The second event is pv magazine USA Week 2026, a virtual event held on October 20, 21 and 22. 

The theme for day one of the event is U.S. Solar Manufacturing: From Announcement to Implementation. The day’s program will feature a keynote address from a leader in the U.S. solar manufacturing space, and a panel discussion moderated by pv magazine USA senior editor Ryan Kennedy. Further details and registration will be available at the end of the summer. Partnerships are available for booking now at the event page on our global website.

Free Training

Source link

U.S. Clean Energy Manufacturing Surges Ahead Despite Policy Hurdles, Reports The American Clean Power Association


Representational image. Credit: Canva

Momentum in the American clean energy manufacturing sector continues to build despite ongoing policy challenges, according to the second annual State of Clean Energy Manufacturing report released by the American Clean Power Association. The report shows that clean energy manufacturing has become a key pillar of the U.S. industrial economy, offering affordable, reliable and quickly deployable domestic solutions to meet the nation’s growing energy needs.

By increasing production within the United States, the industry also boosts national security by reducing dependence on foreign energy supplies and international supply chains.Speaking about the findings, Jason Grumet emphasized that rising energy demand makes it essential to expand clean power systems built in the U.S.

He explained that to sustain the current manufacturing growth, the country needs clear, targeted and consistent international trade policies. This includes reasonable timelines for complying with tariffs and greater regulatory certainty, which would allow clean energy manufacturers to continue supporting economic development and strengthening local communities across the nation.The report highlights several important trends.

It notes that every clean energy manufacturing job generates four additional jobs across the wider economy—one through supply-chain activities and three more through household spending. It also points out that more than 235 new clean energy manufacturing facilities have opened in the United States over the past five years.

Today, more than 300 factories nationwide produce essential components such as wind turbine blades, towers, nacelles, solar modules and batteries. The report further states that domestic manufacturing capacity is now sufficient to fully meet U.S. demand for solar modules, battery modules, wind towers and wind nacelles.

Overall, the findings reinforce that clean energy manufacturing is not only advancing the country’s energy infrastructure but also significantly contributing to economic growth and national resilience, even in the face of policy headwinds.

Free Training

Source link

Inox Clean Energy’s $750M U.S. Solar Manufacturing Acquisition: 3 GW Module + 3 GW Cell Capacity – News and Statistics


May 16, 2026

Inox Clean Energy Ltd, the renewable energy arm of the Inoxgfl Group, has finalized the purchase of Boviet Solar’s manufacturing operations in North Carolina. This information was originally reported by pv magazine India.

Through its fully owned subsidiary Inox Solar Americas LLC, the company has added 3 GW of functioning TOPCon solar module production capacity to its holdings. Furthermore, a binding commitment exists to secure an extra 3 GW of TOPCon cell production capacity, which is slated to begin operations by the end of 2026. This deal is noted as one of the most significant purchases of U.S. renewable energy assets by an Indian firm.

The acquisition positions Inox Clean among the leading Indian integrated renewable energy manufacturers in the U.S. and marks a calculated entry into a rapidly expanding solar market. Inox Clean stated that the purchase unlocks considerable financial advantages through U.S. domestic manufacturing incentives. Goods produced at the site will be eligible for Section 45X tax credits, which the company says will bolster profitability and lower exposure to tariffs and policy uncertainties by relying on a domestic production base.

The company further explained that the acquisition offers an immediately available and expandable platform in a high-margin, policy-favorable environment. With existing cell supply constraints and the benefits of Section 45X creating advantageous conditions, Inox Clean believes it is well-placed to develop a comprehensive U.S. manufacturing network. The transaction was valued at roughly $750 million for the combined module and cell production assets, and it satisfies all requirements of the company’s valuation strategy.

In the preceding nine months, Inox Clean has carried out nine acquisitions in the independent power producer and solar cell and module manufacturing fields within India and abroad, including the purchases of Vibrant Energy, SkyPower, SunSource Energy, and Wind World India. The company aims to achieve 11 GW of integrated solar manufacturing capacity and 10 GW of operational IPP capacity by the fiscal year 2028, spanning India and key global markets such as the United States and Africa.

  1. 1. INTRODUCTION

    Making Data-Driven Decisions to Grow Your Business

    1. REPORT DESCRIPTION
    2. RESEARCH METHODOLOGY AND THE AI PLATFORM
    3. DATA-DRIVEN DECISIONS FOR YOUR BUSINESS
    4. GLOSSARY AND SPECIFIC TERMS
  2. 2. EXECUTIVE SUMMARY

    A Quick Overview of Market Performance

    1. KEY FINDINGS
    2. MARKET TRENDS This Chapter is Available Only for the Professional EditionPRO
  3. 3. MARKET OVERVIEW

    Understanding the Current State of The Market and its Prospects

    1. MARKET SIZE: HISTORICAL DATA (2012–2025) AND FORECAST (2026–2035)
    2. CONSUMPTION BY COUNTRY: HISTORICAL DATA (2012–2025) AND FORECAST (2026–2035)
    3. MARKET FORECAST TO 2035
  4. 4. MOST PROMISING PRODUCTS FOR DIVERSIFICATION

    Finding New Products to Diversify Your Business

    1. TOP PRODUCTS TO DIVERSIFY YOUR BUSINESS
    2. BEST-SELLING PRODUCTS
    3. MOST CONSUMED PRODUCTS
    4. MOST TRADED PRODUCTS
    5. MOST PROFITABLE PRODUCTS FOR EXPORT
  5. 5. MOST PROMISING SUPPLYING COUNTRIES

    Choosing the Best Countries to Establish Your Sustainable Supply Chain

    1. TOP COUNTRIES TO SOURCE YOUR PRODUCT
    2. TOP PRODUCING COUNTRIES
    3. TOP EXPORTING COUNTRIES
    4. LOW-COST EXPORTING COUNTRIES
  6. 6. MOST PROMISING OVERSEAS MARKETS

    Choosing the Best Countries to Boost Your Export

    1. TOP OVERSEAS MARKETS FOR EXPORTING YOUR PRODUCT
    2. TOP CONSUMING MARKETS
    3. UNSATURATED MARKETS
    4. TOP IMPORTING MARKETS
    5. MOST PROFITABLE MARKETS
  7. 7. PRODUCTION

    The Latest Trends and Insights into The Industry

    1. PRODUCTION VOLUME AND VALUE: HISTORICAL DATA (2012–2025) AND FORECAST (2026–2035)
    2. PRODUCTION BY COUNTRY: HISTORICAL DATA (2012–2025) AND FORECAST (2026–2035)
  8. 8. IMPORTS

    The Largest Import Supplying Countries

    1. IMPORTS: HISTORICAL DATA (2012–2025) AND FORECAST (2026–2035)
    2. IMPORTS BY COUNTRY: HISTORICAL DATA (2012–2025) AND FORECAST (2026–2035)
    3. IMPORT PRICES BY COUNTRY: HISTORICAL DATA (2012–2025) AND FORECAST (2026–2035)
  9. 9. EXPORTS

    The Largest Destinations for Exports

    1. EXPORTS: HISTORICAL DATA (2012–2025) AND FORECAST (2026–2035)
    2. EXPORTS BY COUNTRY: HISTORICAL DATA (2012–2025) AND FORECAST (2026–2035)
    3. EXPORT PRICES BY COUNTRY: HISTORICAL DATA (2012–2025) AND FORECAST (2026–2035)
  10. 10. PROFILES OF MAJOR PRODUCERS

    The Largest Producers on The Market and Their Profiles

  11. 11. COUNTRY PROFILES

    The Largest Markets And Their Profiles

    This Chapter is Available Only for the Professional Edition
    PRO

    1. 11.1

      United States

      • Market Size
      • Production
      • Imports
      • Exports
    2. 11.2

      China

      • Market Size
      • Production
      • Imports
      • Exports
    3. 11.3

      Japan

      • Market Size
      • Production
      • Imports
      • Exports
    4. 11.4

      Germany

      • Market Size
      • Production
      • Imports
      • Exports
    5. 11.5

      United Kingdom

      • Market Size
      • Production
      • Imports
      • Exports
    6. 11.6

      France

      • Market Size
      • Production
      • Imports
      • Exports
    7. 11.7

      Brazil

      • Market Size
      • Production
      • Imports
      • Exports
    8. 11.8

      Italy

      • Market Size
      • Production
      • Imports
      • Exports
    9. 11.9

      Russian Federation

      • Market Size
      • Production
      • Imports
      • Exports
    10. 11.10

      India

      • Market Size
      • Production
      • Imports
      • Exports
    11. 11.11

      Canada

      • Market Size
      • Production
      • Imports
      • Exports
    12. 11.12

      Australia

      • Market Size
      • Production
      • Imports
      • Exports
    13. 11.13

      Republic of Korea

      • Market Size
      • Production
      • Imports
      • Exports
    14. 11.14

      Spain

      • Market Size
      • Production
      • Imports
      • Exports
    15. 11.15

      Mexico

      • Market Size
      • Production
      • Imports
      • Exports
    16. 11.16

      Indonesia

      • Market Size
      • Production
      • Imports
      • Exports
    17. 11.17

      Netherlands

      • Market Size
      • Production
      • Imports
      • Exports
    18. 11.18

      Turkey

      • Market Size
      • Production
      • Imports
      • Exports
    19. 11.19

      Saudi Arabia

      • Market Size
      • Production
      • Imports
      • Exports
    20. 11.20

      Switzerland

      • Market Size
      • Production
      • Imports
      • Exports
    21. 11.21

      Sweden

      • Market Size
      • Production
      • Imports
      • Exports
    22. 11.22

      Nigeria

      • Market Size
      • Production
      • Imports
      • Exports
    23. 11.23

      Poland

      • Market Size
      • Production
      • Imports
      • Exports
    24. 11.24

      Belgium

      • Market Size
      • Production
      • Imports
      • Exports
    25. 11.25

      Argentina

      • Market Size
      • Production
      • Imports
      • Exports
    26. 11.26

      Norway

      • Market Size
      • Production
      • Imports
      • Exports
    27. 11.27

      Austria

      • Market Size
      • Production
      • Imports
      • Exports
    28. 11.28

      Thailand

      • Market Size
      • Production
      • Imports
      • Exports
    29. 11.29

      United Arab Emirates

      • Market Size
      • Production
      • Imports
      • Exports
    30. 11.30

      Colombia

      • Market Size
      • Production
      • Imports
      • Exports
    31. 11.31

      Denmark

      • Market Size
      • Production
      • Imports
      • Exports
    32. 11.32

      South Africa

      • Market Size
      • Production
      • Imports
      • Exports
    33. 11.33

      Malaysia

      • Market Size
      • Production
      • Imports
      • Exports
    34. 11.34

      Israel

      • Market Size
      • Production
      • Imports
      • Exports
    35. 11.35

      Singapore

      • Market Size
      • Production
      • Imports
      • Exports
    36. 11.36

      Egypt

      • Market Size
      • Production
      • Imports
      • Exports
    37. 11.37

      Philippines

      • Market Size
      • Production
      • Imports
      • Exports
    38. 11.38

      Finland

      • Market Size
      • Production
      • Imports
      • Exports
    39. 11.39

      Chile

      • Market Size
      • Production
      • Imports
      • Exports
    40. 11.40

      Ireland

      • Market Size
      • Production
      • Imports
      • Exports
    41. 11.41

      Pakistan

      • Market Size
      • Production
      • Imports
      • Exports
    42. 11.42

      Greece

      • Market Size
      • Production
      • Imports
      • Exports
    43. 11.43

      Portugal

      • Market Size
      • Production
      • Imports
      • Exports
    44. 11.44

      Kazakhstan

      • Market Size
      • Production
      • Imports
      • Exports
    45. 11.45

      Algeria

      • Market Size
      • Production
      • Imports
      • Exports
    46. 11.46

      Czech Republic

      • Market Size
      • Production
      • Imports
      • Exports
    47. 11.47

      Qatar

      • Market Size
      • Production
      • Imports
      • Exports
    48. 11.48

      Peru

      • Market Size
      • Production
      • Imports
      • Exports
    49. 11.49

      Romania

      • Market Size
      • Production
      • Imports
      • Exports
    50. 11.50

      Vietnam

      • Market Size
      • Production
      • Imports
      • Exports
  12. LIST OF TABLES

    1. Key Findings In 2025
    2. Market Volume, In Physical Terms: Historical Data (2012–2025) and Forecast (2026–2035)
    3. Market Value: Historical Data (2012–2025) and Forecast (2026–2035)
    4. Per Capita Consumption, by Country, 2022–2025
    5. Production, In Physical Terms, By Country: Historical Data (2012–2025) and Forecast (2026–2035)
    6. Imports, In Physical Terms, By Country: Historical Data (2012–2025) and Forecast (2026–2035)
    7. Imports, In Value Terms, By Country: Historical Data (2012–2025) and Forecast (2026–2035)
    8. Import Prices, By Country: Historical Data (2012–2025) and Forecast (2026–2035)
    9. Exports, In Physical Terms, By Country: Historical Data (2012–2025) and Forecast (2026–2035)
    10. Exports, In Value Terms, By Country: Historical Data (2012–2025) and Forecast (2026–2035)
    11. Export Prices, By Country: Historical Data (2012–2025) and Forecast (2026–2035)
  13. LIST OF FIGURES

    1. Market Volume, In Physical Terms: Historical Data (2012–2025) and Forecast (2026–2035)
    2. Market Value: Historical Data (2012–2025) and Forecast (2026–2035)
    3. Consumption, by Country, 2025
    4. Market Volume Forecast to 2035
    5. Market Value Forecast to 2035
    6. Market Size and Growth, By Product
    7. Average Per Capita Consumption, By Product
    8. Exports and Growth, By Product
    9. Export Prices and Growth, By Product
    10. Production Volume and Growth
    11. Exports and Growth
    12. Export Prices and Growth
    13. Market Size and Growth
    14. Per Capita Consumption
    15. Imports and Growth
    16. Import Prices
    17. Production, In Physical Terms: Historical Data (2012–2025) and Forecast (2026–2035)
    18. Production, In Value Terms: Historical Data (2012–2025) and Forecast (2026–2035)
    19. Production, by Country, 2025
    20. Production, In Physical Terms, by Country: Historical Data (2012–2025) and Forecast (2026–2035)
    21. Imports, In Physical Terms: Historical Data (2012–2025) and Forecast (2026–2035)
    22. Imports, In Value Terms: Historical Data (2012–2025) and Forecast (2026–2035)
    23. Imports, In Physical Terms, By Country, 2025
    24. Imports, In Physical Terms, By Country: Historical Data (2012–2025) and Forecast (2026–2035)
    25. Imports, In Value Terms, By Country: Historical Data (2012–2025) and Forecast (2026–2035)
    26. Import Prices, By Country: Historical Data (2012–2025) and Forecast (2026–2035)
    27. Exports, In Physical Terms: Historical Data (2012–2025) and Forecast (2026–2035)
    28. Exports, In Value Terms: Historical Data (2012–2025) and Forecast (2026–2035)
    29. Exports, In Physical Terms, By Country, 2025
    30. Exports, In Physical Terms, By Country: Historical Data (2012–2025) and Forecast (2026–2035)
    31. Exports, In Value Terms, By Country: Historical Data (2012–2025) and Forecast (2026–2035)
    32. Export Prices, By Country: Historical Data (2012–2025) and Forecast (2026–2035)

Free Training

Source link

The State of Clean Energy Manufacturing in Q1 2026: Environmental Defense Fund Report | Mitchell, Williams, Selig, Gates & Woodyard, P.L.L.C.


Introduction –

2025 represented a turning point in clean energy manufacturing in the United States. From 2021 to 2024, the country experienced an unprecedented clean energy manufacturing boom supported by federal policies that accelerated private investment. In 2025, growth in clean energy manufacturing largely declined in the wake of the Trump administration’s policies and congressional cuts to clean energy tax credits.

Please see full publication below for more information.

Free Training

Source link

Understanding the global clean tech manufacturing slowdown


Investment in clean technology manufacturing facilities is falling worldwide. After peaking at $70 billion in 2023, quarterly manufacturing investment more than halved to $35 billion by end-2025. This is despite global demand for clean technologies growing rapidly. Since 2020, solar installations have more than tripled in China (+250 percent), while more than doubling in the United States and European Union (+132 percent and +125 percent, respectively). Also since 2020, electric vehicle (EV) sales in China have grown nearly tenfold, in the US fourfold and in the EU threefold. These three economies host 86 percent of total clean-technology manufacturing investment since 2018.

In the context of growing demand, why is global clean-tech manufacturing investment slowing? We examine the three largest clean-tech sectors: solar, batteries and EVs. The headline fall largely reflects an oversupplied market, especially falling Chinese investment in solar photovoltaic manufacturing (Figure 1) – in this respect the decline is not a cause for concern. However, the drop in battery manufacturing investment that has followed abrupt US policy changes is worrying. Amid the slowdown, European investment remains largely stable.

Overcapacity and policy reversals

Most of the global clean-tech investment drop relates to China, where investment in 2025 was down nearly 70 percent from a peak in 2023 (Figure 2). This followed years of state-led investment that secured dominance for China in solar, battery and EV supply chains and allowed Chinese firms to produce at prices no competitor could match. But the strategy also drove overcapacity and domestic price wars. To rein in overcapacity, the Chinese government has adjusted policy since 2024 (Davidson and Qian, 2026).

Meanwhile, access to foreign markets for Chinese goods has tightened, with steep US tariffs on Chinese clean technology and European tariffs on EVs. This has led some Chinese companies to shift investment overseas.

Declining clean-tech investment in the US is driven by policy, especially the dismantling under President Donald Trump of the 2022 Inflation Reduction Act (IRA), which provided clean-tech subsidies. Since mid-2025, some subsidies have been cut and certain tax credits phased out. Many clean-tech manufacturing projects have since been cancelled, with €7 billion worth of project cancellations in the first quarter of 2025 and another €5 billion in the second quarter (Rhodium Group, 2025).

European manufacturing investment has remained stable, though EV investment has slowed because of weaker than expected demand growth, partly driven by a European Commission proposal to reduce to 90 percent a goal for zero-emission passenger vehicles to comprise 100 percent of new sales in 2035 (European Commission, 2025). Unlike the US however, the EU remains broadly committed to its climate targets, which favours clean-tech investment. The EU Net-Zero Industry Act (Regulation (EU) 2024/1735) sets a target for the bloc to meet 40 percent of its clean-tech demand from domestic manufacturing by 2030. European governments have provided subsidies to support manufacturing projects for selected clean technologies, especially batteries and EVs. The rollback of US climate policy and imposition of tariffs is reducing an important export market for EU manufacturers. Monthly net EU EV exports to the US have fallen from €1.5 billion to €300 million since the beginning of 2025.

Supply-demand imbalances contribute to slowing solar investment

More than 90 percent of the world’s solar PV manufacturing capacity is in China, with just one percent in the EU and two percent in the US (Rhodium Group, 2025). The Chinese government identified solar energy as a strategic sector in the early 2000s, and a combination of land subsidies, cheap loans and low-cost financing backed an enormous manufacturing push. Five-Year Plans set binding targets for installation, creating certainty on the demand side (IEA, 2022). As factories expanded, solar panel costs fell and Chinese companies became the default suppliers for buyers worldwide.

Intense Chinese competition saw solar module prices fall by about two thirds between 2022 and 2024. Subsequently, changes were made to Chinese state support to reign in price wars and rationalise the industry (Davidson and Qian, 2026). Since 2024, firms must fund at least 30 percent of project costs through equity rather than debt and new efficiency standards have been introduced. New power-market reforms now expose solar to market-based pricing. Consequently, Chinese solar manufacturing investment fell from €83 billion in 2023 to €15 billion in 2025, the single largest driver of the global clean-tech investment slowdown.  

This however will not fundamentally change China’s dominance of global solar PV manufacturing. Current Chinese solar cell manufacturing capacity of 1,200 GW already meets annual domestic solar demand four times over and global demand more than twice over. Already underway investment is on track to add an additional one third to Chinese capacity in the next few years (Figure 3). 

Solar manufacturing investments in the US and EU are not comparable to China. The IRA encouraged through tax credits US solar manufacturing investment, leading to a rapid expansion of domestic capacity. However, the Trump administration has shortened eligibility windows for credits and tightened sourcing restrictions, slowing new developments. This has reduced the business case for new projects, and announced US solar manufacturing investment fell to $3.25 billion in 2025, down from a peak of $11.25 billion in 2023. 

Europe’s manufacturing capacity remains limited. Enel’s 3SUN gigafactory is the largest operational plant in Europe with a 3 GW capacity, equivalent to approximately 5 percent of annual European solar PV demand. A handful of projects concentrated in Spain, France and the Netherlands are at a very early stage and considering final investment decisions

From 2026, under the Net-Zero Industry Act, European governments must introduce requirements for public authorities to favour bids that diversify away from dominant third-country suppliers, in sectors in which the EU is particularly dependent on a single country. This is the case for EU imports of Chinese solar PV, and the change will marginally reduce the attractiveness of Chinese imports. However, the economic rationale for replacing Chinese solar panel supply with domestic production is weak (McWilliams et al, 2024). Governments remain reluctant to offer the necessarily substantial fiscal support to domestic solar manufacturers.

Europe is adopting a more targeted approach aimed at reducing dependence on Chinese supply for solar components that are considered security relevant. In May 2026, the EU barred the use of Chinese inverters, which convert solar energy into a form suitable for the power grid, for European publicly funded solar projects. The European Commission considers the inverter to represent a cybersecurity risk because of the possibility of remotely operated shutdowns.

Sharp contraction in battery manufacturing investment is a concern for the US

Similarly to solar PV, China remains the dominant global battery and EV market and manufacturing hub, but is entering a managed slowdown phase after years of state-led expansion. A comprehensive policy framework, including purchase subsidies since 2013, the Dual-Credit Policy (ICCT, 2017) and sustained industrial planning, have framed the rapid development of a fully integrated supply chain. The Dual Credit Policy sets rising annual EV credit quotas that carmakers can trade, with foreign battery-makers excluded from subsidies during this crucial phase.

Since 2023, Chinese battery and EV investment has declined as margins have fallen and authorities respond to overcapacity and falling profitability. Policy adjustments in 2024-2025, including tighter battery regulations and revised credit rules, aim to curb price wars and rationalise the industry, shifting towards higher-quality growth.

Some of the slowdown has been offset by growth in the stationary storage market. In 2025, two-thirds of the announced battery investments in China were earmarked for stationary storage, compared to about 15 percent in 2021. 

In the US, the IRA shaped battery and EV investments. In 2022, the IRA introduced a $7,500 consumer EV tax credit, alongside manufacturing subsidies and loans. This support triggered a rapid expansion in battery production and vehicle assembly. Battery manufacturing accounted for three-quarters of the growth in US clean-tech investment between 2021 and the 2024 peak, with investment rising more than fivefold over that period.

However, unlike in China – where the investment slowdown comes after global leadership has been secured – US industrial policy support ended before domestic manufacturing had scaled sufficiently or a robust home market took hold. Changes introduced by the US Congress preserve manufacturing credits in principle but introduce ‘foreign entity of concern’ restrictions that require 60 percent of qualifying battery inputs to come from non-Chinese sources by 2026, rising to 85 percent by 2030 (Elizalde et al, 2025). For most US battery manufacturers, whose supply chains run through China, compliance means costly restructuring or losing the credits entirely. The IRA manufacturing loan programme has been eliminated, while new tariffs have increased import prices.

US EV demand has also fallen sharply, with the expiry of the $7,500 vehicle tax credit in September 2025. Consumer spending on EVs fell 43 percent in the last quarter of 2025 after the previous quarter’s record high, and was down 31 percent on the last quarter of 2024. The EV demand outlook has also weakened following federal rollbacks of vehicle emission standards and fuel economy penalties. The abrupt policy shifts on both the supply and demand side of the EV supply chain have dampened battery manufacturing investment, with $11 billion of investment cancelled in 2025, more than ten times the 2024 level (Figure 4). In two quarters of 2025, cancellations exceeded new announcements. A further $51 billion of investment for US battery projects is still in the planning or construction stages and vulnerable to cancellations or delays.

European EV investment steady for now

In the EU, battery investment remained relatively high throughout 2025, between $1.7 billion and $2.4 billion per quarter, and continues to grow. EV manufacturing investment in the EU has slowed slightly. South Korean companies own most of the operational battery cell capacity in Europe, while Chinese companies are responsible for close to half of ongoing investments. European governments have provided upfront subsidies to these investments and to notable investments by domestic manufacturers, such as Verkor in France.

For the EU, EV and battery demand is guided by a regulation to phase out the sale of new passenger vehicles with exhaust emissions by 2035 (Regulation (EU) 2023/851). Alongside government purchase support, this regulation supports manufacturing investments. The steady tightening of the regulation since 2019 has been mirrored by a steady growth in manufacturing investment. In 2025, a proposal by the European Commission to weaken the 2035 target (European Commission, 2025) partly disrupted what was a stable policy framework. However, the proposed weakening is relatively minor in reducing the 2035 target for zero emission vehicles from 100 percent to 90 per cent (see above). European demand for EVs continues to grow, especially in the context of high petrol and diesel prices since the US-Israel war against Iran and the closure of the Strait of Hormuz

EV production capacity in the EU is already substantial at 4.8 million vehicles annually, compared to a demand close to 2.5 million (Figure 3). The EU has introduced tariffs on the import of Chinese electric vehicles, but these are far lower than those imposed by the US. In 2024, the US was the destination for €10 billion (one quarter) of EU EV exports; the imposition since then of vehicle tariffs by the US has hurt.

References

Bruegel Dataset (2025) ‘European Clean Tech Tracker’, version of 10 January 2026, available at https://doi.org/10.64153/HYOM7675

Davidson, M. and S. Qian (2026) ‘China’s Solar Industry Is in Upheaval—The Effects Will Be Global’, CSIS Briefs, Center for Strategic & International Studies, available at https://www.csis.org/analysis/chinas-solar-industry-upheaval-effects-will-be-global

Dornoff, J., C. Baldino, S. Díaz de Aguilar, E. Mulholland, M. Negri and M. Vega Gonzalo (2025) ‘Unwrapping the package: A review of the European Commission’s CO2 standards proposal’, Policy Brief, International Council on Clean Transportation, available at https://theicct.org/wp-content/uploads/2025/12/ID-537-%E2%80%93-EU-CO2-proposal_policy-brief_final.pdf

Elizalde, D., Z, Urecki and X, Fishman (2025) ‘Unpacking the FEOC Provisions in the House Ways and Means Reconciliation Bill’, Issue Brief, Bipartisan Policy Center, available at https://bipartisanpolicy.org/issue-brief/2025-reconciliation-feoc-provisions-house-ways-and-means-bill/

European Commission (2025) ‘Proposal for a Regulation of the European Parliament and of the Council amending Regulation (EU) 2019/631 as regards CO2 emission performance standards for new passenger cars and new light commercial vehicles’, COM(2025) 995 final, available at https://eur-lex.europa.eu/legal-content/EN/TXT/?uri=celex:52025PC0995

ICCT (2017) ‘China’s New Energy Vehicle Mandate Policy (Final Rule)’, Policy Update, International Council on Clean Transportation, available at https://theicct.org/wp-content/uploads/2021/06/China_NEV_mandate_PolicyUpdate-_20180525.pdf

IEA (2022) Solar PV Global Supply Chains, International Energy Agency, available at https://www.iea.org/reports/solar-pv-global-supply-chains

McWilliams, B., S. Tagliapietra and C. Trasi (2024) ‘Smarter European Union industrial policy for solar panels’, Policy Brief 02/2024, Bruegel, available at https://www.bruegel.org/system/files/2024-02/PB%2002%202024_3.pdf

Rhodium Group (2025) ‘Clean Investment Monitor: US Q2 2025 Update’28 August, available at https://www.cleaninvestmentmonitor.org/reports/q2-2025-update

Free Training

Source link