

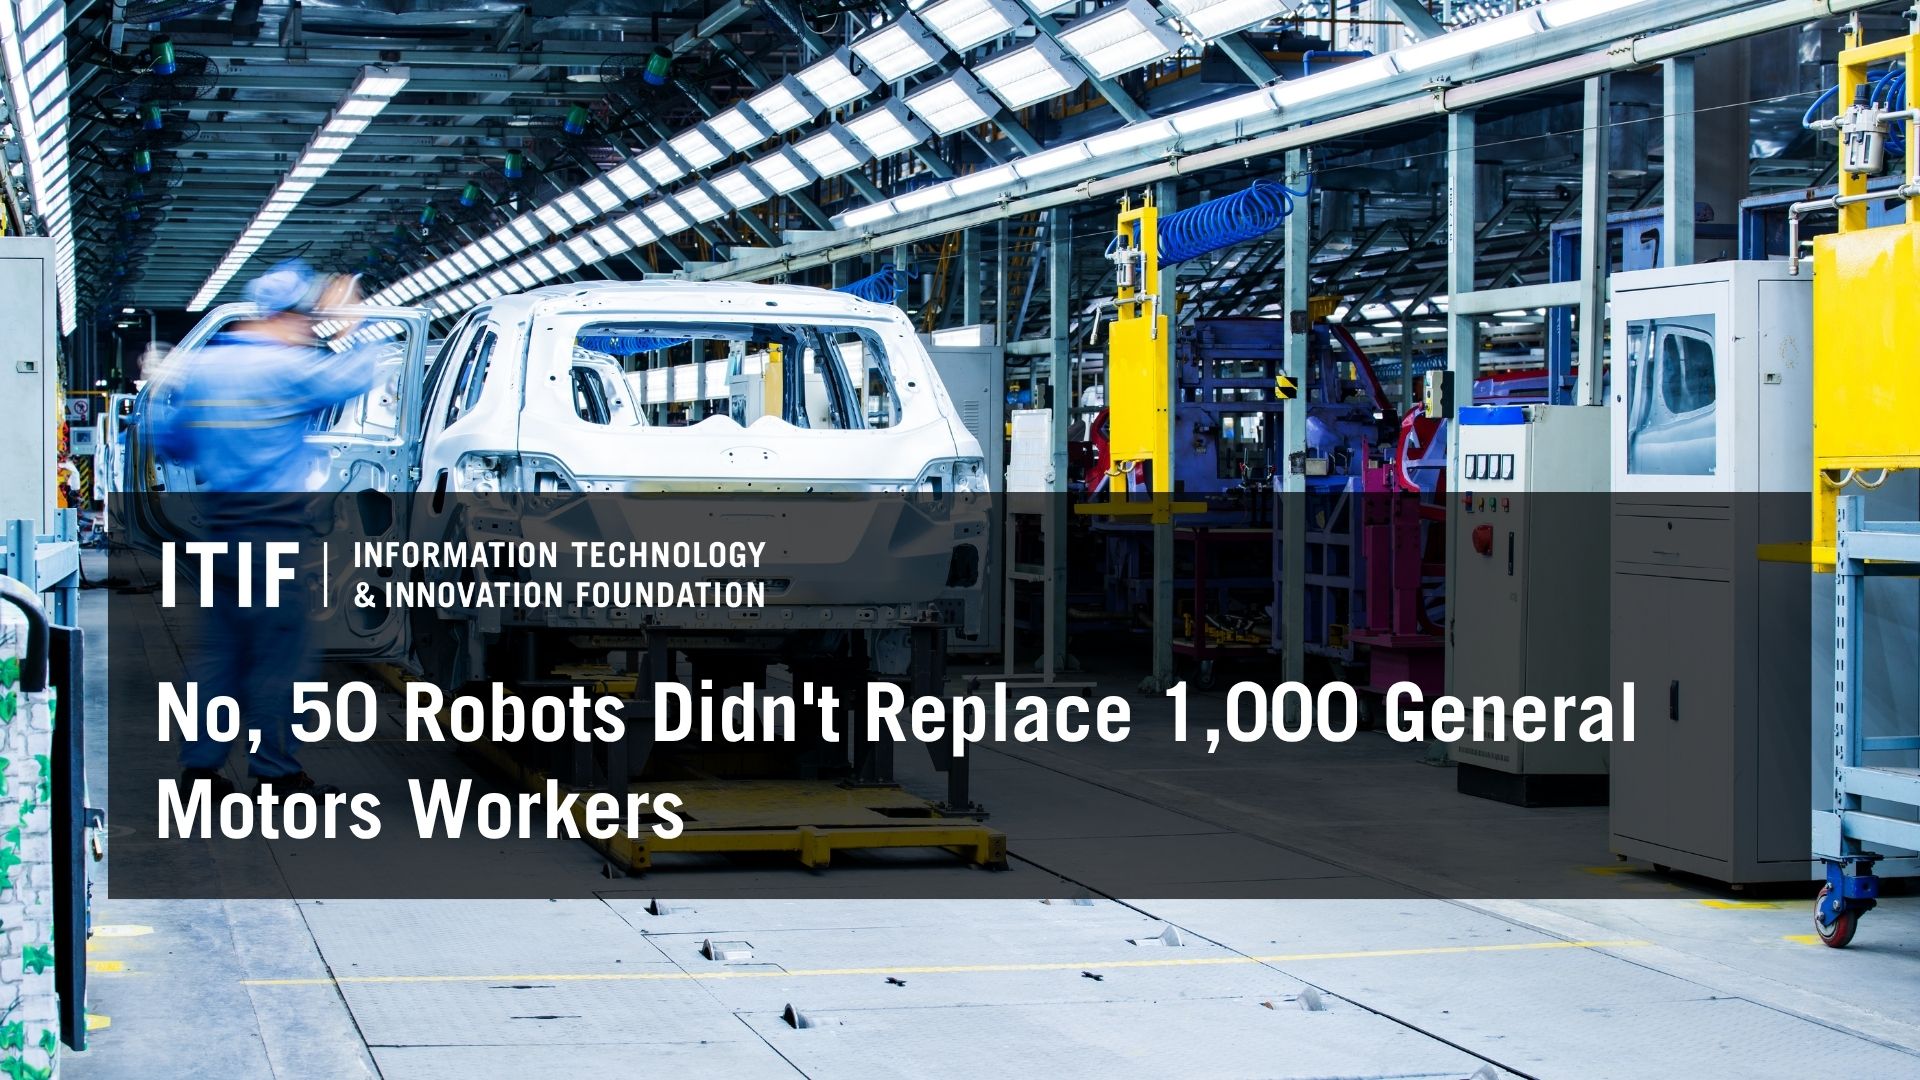
No, 50 Robots Didn’t Replace 1,000 General Motors Workers | Blogs | Jul 13, 2026


A recent article by Futurism highlights how some of the most powerful labor unions in the United States claim that General Motors (GM) fired more than 1,000 workers from its all-electric vehicle facility following the installation of 50 AI-integrated manufacturing robots. However, the claim from union officials that these robots are “taking away jobs from people” is misleading for three reasons. First, the layoffs were far more likely driven by GM scaling back electric vehicle (EV) production because of weaker-than-expected demand and changing production priorities than by the installation of robots. Second, even if these robots did automate certain tasks, that does not mean they replaced the workers who perform the many responsibilities involved in manufacturing vehicles and can instead increase worker efficiency. Finally, even when automation can lead to job displacement, workers are not left permanently unemployed. Policymakers should focus on building workforce retraining programs that help displaced workers develop the skills needed to find new jobs in growing industries.

First, the claim that 50 AI-integrated robots caused the elimination of 1,000 jobs overlooks the broader economic context surrounding GM’s Factory Zero facility, whose primary focus is the production of EV vehicles. While labor unions argue that these robots left 1,000 workers idle before they were eventually fired, the evidence suggests that GM’s factory idled workers because of slower-than-expected EV demand amid changes in EV policy, most notably the end of the federal EV tax credit. Rather than expanding production at Factory Zero, GM has shifted its focus toward heavy-duty pickup truck production, leaving less work available for those at its EV facility.

As explained in an Autoblog article, “Factory Zero temporarily laid off 1,300 workers on March 16, with employees expected to return on April 13. This follows a previous idling late last year, as well as a reduction to a single shift in January 2026. The production halt affects GM’s large all-electric models.” In other words, the workforce reduction coincided with a reduction in EV production. If Americans are buying fewer electric GMC Hummers, Cadillac Escalades, or Chevy Silverados, GM simply does not need as many workers at its EV manufacturing facility. The evidence suggests that weaker demand and changes in production priorities—not simply the installation of 50 robots—were the primary drivers of the layoff.

Second, even if these robots did automate certain tasks, that does not mean they replaced 1,000 employees. Like many jobs in the United States, manufacturing jobs consist of a variety of tasks rather than one single responsibility. Workers at GM’s Factory Zero are no different. They perform quality control, troubleshoot production issues, assemble components, handle materials, and complete numerous other responsibilities throughout the manufacturing process.

By contrast, the 50 robots installed at the facility reportedly perform one specific task: bolting body panels. It is therefore misleading to suggest that these robots replaced 1,000 workers who perform a wide range of activities. Automating one task does not eliminate the need for workers who perform the many other tasks required to manufacture vehicles. Instead, automation changes the composition of work by removing repetitive tasks while allowing workers to focus on activities that require greater problem-solving and technical judgment.

Moreover, if robots did take over this one task, the result could be higher worker and economic productivity. Research has shown that automation increases productivity and economic output. A 2018 study found that greater robot density in manufacturing was associated with higher output and, in turn, stronger GDP growth and improved living standards. Similarly, research from the International Federation of Robotics (IFR) found that collaborative robots can benefit small and medium-sized manufacturers because they are flexible, easier to deploy, and adaptable to changing production requirements. The IFR concluded that robot assistants can “significantly increase workers’ productivity.” For example, when Canada’s Paradigm Electronics implemented collaborative robots, employee productivity increased by 50 percent.

If the objection is that technology enables fewer workers to complete a given task, then why stop at robots? By the same logic, one could just as easily oppose workers using power tools, since they too reduce the number of workers needed to perform a task while increasing productivity.

Finally, even if these robots did contribute to some job loss at Factory Zero, those workers would not remain permanently unemployed. Research on automation suggests that technological change tends to reallocate labor rather than permanently eliminate it. Workers displaced by automation frequently move into new occupations, including jobs created by automation themselves.

As ITIF has previously explained, automation increases productivity, allowing firms to lower prices, raise wages, or both. Lower prices leave consumers with more disposable income, while higher wages increase purchasing power. In either case, consumers and businesses spend and invest more, creating demand for workers throughout the broader economy.

Consider a worker at a cellular phone manufacturing plant. If robots automate many routine phone manufacturing tasks, phones become less expensive to produce, leaving consumers with more money to spend elsewhere, whether on restaurant meals, home renovations, health care, recreation, or other goods and services. Businesses in those sectors would respond to rising demand by hiring additional workers, creating new employment opportunities that help offset job displacement in phone manufacturing.

This dynamic helps explain why studies have found limited evidence that technology-driven automation leads to permanent economy-wide job losses. Instead, productivity growth expands economic output, raises incomes, and supports higher employment over the long run.

Labor union opposition to GM’s use of AI, robots, and automation—which one official called “a fight for humanity”—highlights the broader challenge policymakers will face as the United States seeks to strengthen its economic competitiveness through technological progress. The goal should not be to prevent automation or to preserve every existing task indefinitely. A competitive manufacturing sector depends on adopting technologies that improve productivity, reduce costs, and strengthen U.S. competitiveness.

Rather than opposing technological advancements, union officials should help ensure that workers have pathways to benefit from technological change. To support that transition, policymakers should focus on building workforce retraining programs that help displaced workers develop the skills needed for growing industries. This includes stronger partnerships between manufacturers, community colleges, and technical training programs; expanded apprenticeships in advanced manufacturing; and increasing access to training in areas such as robotics maintenance, industrial automation, and engineering technologies. The solution to technological change is not slowing innovation—especially as the United States is losing leadership to China in critical industries—but ensuring that workers have the skills and support needed to succeed alongside it.

Free Training

Source link

Skild AI Partners with Foxconn, ABB, Universal Robots for Industrial AI in 2026 – News and Statistics


Mar 16, 2026

According to Reuters, Skild AI will deploy its artificial intelligence model in robots operating on Foxconn assembly lines in Houston. These lines are involved in the construction of Nvidia‘s Blackwell GPU server racks. The companies characterized this as an initial commercial use of a generalized physical AI system.

The startup, which has financial backing from Nvidia and SoftBank, announced it would also collaborate with ABB Robotics and Universal Robots. The goal is to integrate its software into a wide range of industrial robots, providing what it terms a general-purpose brain for machinery. Skild AI stated its model is designed to overcome a major constraint of existing robotics, which are often dedicated to one specific task and need significant reprogramming for any change.

Partnerships with ABB and Teradyne‘s Universal Robots unit are aimed at increasing the volume of data for system training by embedding the software into their robots. The CEO of Skild AI indicated that working with original equipment manufacturers that have vast existing robot deployments creates a pathway for significant scaling and establishes a data feedback cycle.

These developments occur as the United States intensifies initiatives to restore its domestic manufacturing base. In 2025, new U.S. production investments totaling approximately $1.2 trillion were announced, primarily in electronics, pharmaceuticals, and semiconductors. Industry leaders note that the large-scale return of advanced manufacturing to the country will rely substantially on automation.

Nvidia, a key supporter of Skild AI, previously stated its intention to manufacture AI supercomputers completely within the United States. A company executive emphasized that with substantial infrastructure investment planned for the coming years, factories will require greater autonomy.

In a related move, SoftBank announced in October its agreement to purchase ABB’s robotics division. That transaction is anticipated to be finalized around the middle to end of 2026. Skild AI itself secured $1.4 billion in a financing round led by Nvidia and SoftBank earlier this year, resulting in a valuation exceeding $14 billion.

This report provides a comprehensive view of the industrial robot industry in the United States, tracking demand, supply, and trade flows across the national value chain. It explains how demand across key channels and end-use segments shapes consumption patterns, while also mapping the role of input availability, production efficiency, and regulatory standards on supply.

Beyond headline metrics, the study benchmarks prices, margins, and trade routes so you can see where value is created and how it moves between domestic suppliers and international partners. The analysis is designed to support strategic planning, market entry, portfolio prioritization, and risk management in the industrial robot landscape in the United States.

Quick navigation

Key findings

  • Domestic demand is shaped by both household and industrial usage, with trade flows linking local supply to imports and exports.
  • Pricing dynamics reflect unit values, freight costs, exchange rates, and regulatory shifts that affect sourcing decisions.
  • Supply depends on input availability and production efficiency, creating a distinct national cost curve.
  • Market concentration varies by segment, creating different competitive landscapes and entry barriers.
  • The 2035 outlook highlights where capacity investment and demand growth are most aligned within the country.

Report scope

The report combines market sizing with trade intelligence and price analytics for the United States. It covers both historical performance and the forward outlook to 2035, allowing you to compare cycles, structural shifts, and policy impacts.

  • Market size and growth in value and volume terms
  • Consumption structure by end-use segments
  • Production capacity, output, and cost dynamics
  • Trade flows, exporters, importers, and balances
  • Price benchmarks, unit values, and margin signals
  • Competitive context and market entry conditions

Product coverage

  • Prodcom 28993935 – Industrial robots for multiple uses (excluding robots designed to perform a specific function (e.g. lifting, handling, loading or unloading))

Country coverage

Country profile and benchmarks

This report provides a consistent view of market size, trade balance, prices, and per-capita indicators for the United States. The profile highlights demand structure and trade position, enabling benchmarking against regional and global peers.

Methodology

The analysis is built on a multi-source framework that combines official statistics, trade records, company disclosures, and expert validation. Data are standardized, reconciled, and cross-checked to ensure consistency across time series.

  • International trade data (exports, imports, and mirror statistics)
  • National production and consumption statistics
  • Company-level information from financial filings and public releases
  • Price series and unit value benchmarks
  • Analyst review, outlier checks, and time-series validation

All data are normalized to a common product definition and mapped to a consistent set of codes. This ensures that comparisons across time are aligned and actionable.

Forecasts to 2035

The forecast horizon extends to 2035 and is based on a structured model that links industrial robot demand and supply to macroeconomic indicators, trade patterns, and sector-specific drivers. The model captures both cyclical and structural factors and reflects known policy and technology shifts in the United States.

  • Historical baseline: 2012-2025
  • Forecast horizon: 2026-2035
  • Scenario-based sensitivity to income growth, substitution, and regulation
  • Capacity and investment outlook for major producing companies

Each projection is built from national historical patterns and the broader regional context, allowing the report to show where growth is concentrated and where risks are elevated.

Price analysis and trade dynamics

Prices are analyzed in detail, including export and import unit values, regional spreads, and changes in trade costs. The report highlights how seasonality, freight rates, exchange rates, and supply disruptions influence pricing and margins.

  • Price benchmarks by country and sub-region
  • Export and import unit value trends
  • Seasonality and calendar effects in trade flows
  • Price outlook to 2035 under baseline assumptions

Profiles of market participants

Key producers, exporters, and distributors are profiled with a focus on their operational scale, geographic footprint, product mix, and market positioning. This helps identify competitive pressure points, partnership opportunities, and routes to differentiation.

  • Business focus and production capabilities
  • Geographic reach and distribution networks
  • Cost structure and pricing strategy indicators
  • Compliance, certification, and sustainability context

How to use this report

  • Quantify domestic demand and identify the most attractive segments
  • Evaluate export opportunities and prioritize target destinations
  • Track price dynamics and protect margins
  • Benchmark performance against leading competitors
  • Build evidence-based forecasts for investment decisions

This report is designed for manufacturers, distributors, importers, wholesalers, investors, and advisors who need a clear, data-driven picture of industrial robot dynamics in the United States.

FAQ

What is included in the industrial robot market in the United States?

The market size aggregates consumption and trade data, presented in both value and volume terms.

How are the forecasts to 2035 built?

The projections combine historical trends with macroeconomic indicators, trade dynamics, and sector-specific drivers.

Does the report cover prices and margins?

Yes, it includes export and import unit values, regional spreads, and a pricing outlook to 2035.

Which benchmarks are included?

The report benchmarks market size, trade balance, prices, and per-capita indicators for the United States.

Can this report support market entry decisions?

Yes, it highlights demand hotspots, trade routes, pricing trends, and competitive context.

  1. 1. INTRODUCTION

    Making Data-Driven Decisions to Grow Your Business

    1. REPORT DESCRIPTION
    2. RESEARCH METHODOLOGY AND THE AI PLATFORM
    3. DATA-DRIVEN DECISIONS FOR YOUR BUSINESS
    4. GLOSSARY AND SPECIFIC TERMS
  2. 2. EXECUTIVE SUMMARY

    A Quick Overview of Market Performance

    1. KEY FINDINGS
    2. MARKET TRENDSThis Chapter is Available Only for the Professional EditionPRO
  3. 3. MARKET OVERVIEW

    Understanding the Current State of The Market and its Prospects

    1. MARKET SIZE: HISTORICAL DATA (2012–2025) AND FORECAST (2026–2035)
    2. MARKET STRUCTURE: HISTORICAL DATA (2012–2025) AND FORECAST (2026–2035)
    3. TRADE BALANCE: HISTORICAL DATA (2012–2025) AND FORECAST (2026–2035)
    4. PER CAPITA CONSUMPTION: HISTORICAL DATA (2012–2025) AND FORECAST (2026–2035)
    5. MARKET FORECAST TO 2035
  4. 4. MOST PROMISING PRODUCTS FOR DIVERSIFICATION

    Finding New Products to Diversify Your Business

    1. TOP PRODUCTS TO DIVERSIFY YOUR BUSINESS
    2. BEST-SELLING PRODUCTS
    3. MOST CONSUMED PRODUCTS
    4. MOST TRADED PRODUCTS
    5. MOST PROFITABLE PRODUCTS FOR EXPORTS
  5. 5. MOST PROMISING SUPPLYING COUNTRIES

    Choosing the Best Countries to Establish Your Sustainable Supply Chain

    1. TOP COUNTRIES TO SOURCE YOUR PRODUCT
    2. TOP PRODUCING COUNTRIES
    3. TOP EXPORTING COUNTRIES
    4. LOW-COST EXPORTING COUNTRIES
  6. 6. MOST PROMISING OVERSEAS MARKETS

    Choosing the Best Countries to Boost Your Export

    1. TOP OVERSEAS MARKETS FOR EXPORTING YOUR PRODUCT
    2. TOP CONSUMING MARKETS
    3. UNSATURATED MARKETS
    4. TOP IMPORTING MARKETS
    5. MOST PROFITABLE MARKETS
  7. 7. PRODUCTION

    The Latest Trends and Insights into The Industry

    1. PRODUCTION VOLUME AND VALUE: HISTORICAL DATA (2012–2025) AND FORECAST (2026–2035)
  8. 8. IMPORTS

    The Largest Import Supplying Countries

    1. IMPORTS: HISTORICAL DATA (2012–2025) AND FORECAST (2026–2035)
    2. IMPORTS BY COUNTRY: HISTORICAL DATA (2012–2025)
    3. IMPORT PRICES BY COUNTRY: HISTORICAL DATA (2012–2025)
  9. 9. EXPORTS

    The Largest Destinations for Exports

    1. EXPORTS: HISTORICAL DATA (2012–2025) AND FORECAST (2026–2035)
    2. EXPORTS BY COUNTRY: HISTORICAL DATA (2012–2025)
    3. EXPORT PRICES BY COUNTRY: HISTORICAL DATA (2012–2025)
  10. 10. PROFILES OF MAJOR PRODUCERS

    The Largest Producers on The Market and Their Profiles

  11. LIST OF TABLES

    1. Key Findings In 2025
    2. Market Volume, In Physical Terms: Historical Data (2012–2025) and Forecast (2026–2035)
    3. Market Value: Historical Data (2012–2025) and Forecast (2026–2035)
    4. Per Capita Consumption: Historical Data (2012–2025) and Forecast (2026–2035)
    5. Imports, In Physical Terms, By Country, 2012–2025
    6. Imports, In Value Terms, By Country, 2012–2025
    7. Import Prices, By Country, 2012–2025
    8. Exports, In Physical Terms, By Country, 2012–2025
    9. Exports, In Value Terms, By Country, 2012–2025
    10. Export Prices, By Country, 2012–2025
  12. LIST OF FIGURES

    1. Market Volume, In Physical Terms: Historical Data (2012–2025) and Forecast (2026–2035)
    2. Market Value: Historical Data (2012–2025) and Forecast (2026–2035)
    3. Market Structure – Domestic Supply vs. Imports, in Physical Terms: Historical Data (2012–2025) and Forecast (2026–2035)
    4. Market Structure – Domestic Supply vs. Imports, in Value Terms: Historical Data (2012–2025) and Forecast (2026–2035)
    5. Trade Balance, In Physical Terms: Historical Data (2012–2025) and Forecast (2026–2035)
    6. Trade Balance, In Value Terms: Historical Data (2012–2025) and Forecast (2026–2035)
    7. Per Capita Consumption: Historical Data (2012–2025) and Forecast (2026–2035)
    8. Market Volume Forecast to 2035
    9. Market Value Forecast to 2035
    10. Market Size and Growth, By Product
    11. Average Per Capita Consumption, By Product
    12. Exports and Growth, By Product
    13. Export Prices and Growth, By Product
    14. Production Volume and Growth
    15. Exports and Growth
    16. Export Prices and Growth
    17. Market Size and Growth
    18. Per Capita Consumption
    19. Imports and Growth
    20. Import Prices
    21. Production, In Physical Terms: Historical Data (2012–2025) and Forecast (2026–2035)
    22. Production, In Value Terms: Historical Data (2012–2025) and Forecast (2026–2035)
    23. Imports, In Physical Terms: Historical Data (2012–2025) and Forecast (2026–2035)
    24. Imports, In Value Terms: Historical Data (2012–2025) and Forecast (2026–2035)
    25. Imports, In Physical Terms, By Country, 2025
    26. Imports, In Physical Terms, By Country, 2012–2025
    27. Imports, In Value Terms, By Country, 2012–2025
    28. Import Prices, By Country, 2012–2025
    29. Exports, In Physical Terms: Historical Data (2012–2025) and Forecast (2026–2035)
    30. Exports, In Value Terms: Historical Data (2012–2025) and Forecast (2026–2035)
    31. Exports, In Physical Terms, By Country, 2025
    32. Exports, In Physical Terms, By Country, 2012–2025
    33. Exports, In Value Terms, By Country, 2012–2025
    34. Export Prices, By Country, 2012–2025

Free Training

Source link