XTEND Highlights U.S. Drone Manufacturing Expansion as New Tariffs Strengthen Case for Domestic NDAA-Compliant Supply Chain


~ New Tariffs of Up to 100% on Imported Drones Underscore the Case for the Domestic, NDAA-Compliant Manufacturing Base XTEND Has Been Building ~

~ Company’s Growing Tampa-Based XFAB Facility and U.S. Manufacturing Relationships Support XTEND’s Plans to Scale Production as America Reduces Reliance on Foreign-Made Drone Technology ~

TAMPA, Fla., Aug. 14, 2026 (GLOBE NEWSWIRE) —

JFB Construction Holdings (Nasdaq: JFB) announced today that XTEND, a leader in AI-powered autonomy and software-defined robotics, is positioned to support America’s newly announced drive to strengthen its domestic drone industrial base. President Trump this week signed a proclamation imposing tariffs of up to 100% on imported drones and certain drone components, citing national security risks tied to foreign-made, and in particular Chinese-made, unmanned aircraft technology and the need to strengthen the U.S. drone industrial base. Under the proclamation, drones weighing more than 25 kilograms or equipped with thermal imaging, along with their docking stations and critical components, are subject to a 100% tariff, while smaller drones lacking security-sensitive features and other drone components face a 25% tariff, with most provisions taking effect within 21 days of signing.

As the United States moves decisively to strengthen its domestic drone industrial base and reduce dependence on Chinese technology, XTEND finds itself exactly where it was built to be.

XTEND has been developing and supplying NDAA-compliant drone technology and robotic systems to the U.S. Department of War (“DOW”), winning U.S. defense programs and investing in the American manufacturing infrastructure needed to produce them at scale in the United States.

XTEND’s growing U.S. manufacturing facility, XFAB, in Tampa, Florida, which XTEND is continuing to develop and expand, was built around this exact vision, which is directly aligned with the objectives of the new proclamation: bring critical drone technology, components and manufacturing to the United States and create a secure American alternative to foreign-controlled supply chains. The Tampa facility is the U.S. anchor of XTEND’s global XFAB manufacturing network, which combines localized regional production with centralized software innovation through its proprietary XTEND Operating System (XOS) across facilities in the United States, the United Kingdom, Singapore, Israel, and Latvia. Earlier this month, XTEND announced that it had produced seven robotic platforms across its five global XFAB facilities in a single week, all powered by XOS. As XTEND continues to build out its U.S. production capacity, it also works with U.S.-based manufacturers to support increased production. XTEND believes it brings not only its technology, but also its proven XFAB model for building a network of American manufacturing at scale.

Beyond defense, XTEND is also expanding into the private security market, and expects its ability to deliver NDAA-compliant drones manufactured in the United States to be a competitive advantage there as well, as private security customers increasingly prioritize secure, domestically manufactured systems.

Today, that vision has become a national priority.

XTEND wasn’t built in response to this moment. XTEND was built for it.

“We made the bet that America would need a homegrown, NDAA-compliant alternative to Chinese drone technology, and we are building XFAB, our people and our supply chain around that bet,” said Aviv Shapira, Chief Executive Officer of XTEND. “These tariffs validate what our defense customers have known for years: security and resilience start with who builds your technology and where. We’re not reacting to this moment; we’ve been preparing for it since day one, and we’re building the capacity to scale.”

To sign up to receive press releases in real time, please visit ir.xtend.me.

As announced on February 17, 2026, JFB Construction Holdings (Nasdaq: JFB) and XTEND entered into a definitive agreement to combine in an all-stock transaction. The business combination is further supported by strategic investments from Eric Trump, Unusual Machines, American Ventures, LLC, Protego Ventures, and Aliya Capital. The U.S. Securities and Exchange Commission declared the registration statement on Form S-4 relating to the transaction effective on August 11, 2026, clearing the way toward an anticipated closing on September 1, 2026, subject to customary closing conditions. Upon closing, the combined company will be renamed XTEND AI Robotics, Inc., a U.S. public company incorporated in Delaware, and is expected to trade on the New York Stock Exchange under the ticker symbol “XTND.” The closing will complete XTEND’s transition to a U.S.-domiciled public company, aligning its corporate structure with its growing American manufacturing footprint.

About XTEND

XTEND is a leader in software systems and artificial intelligence-powered robotics, deployed in high-threat, complex operational environments where human exposure carries significant risk. Powered by its proprietary XTEND Operating System (XOS), XTEND’s integrated software and advanced robotic hardware solutions are designed to provide autonomy at the edge. Operating across defense, law enforcement, and private security missions through a platform of robots, drones, and robotic subsystems, XTEND’s open architecture platform facilitates scalability across partners and third-party applications. With over 12,500 systems deployed in over 30 countries, XTEND’s solutions have been validated in five combat zones and operationally deployed by national defense, special-mission units, and security organizations across the globe. Founded in Tel Aviv, Israel, and headquartered in Tampa, Florida, XTEND delivers NDAA-compliant solutions through a global network of regional XFAB manufacturing facilities located in the U.S., the U.K., Singapore, Israel, and Latvia. XTEND has previously announced a proposed business combination with JFB Construction Holdings (Nasdaq: JFB); upon closing, the combined company will be renamed XTEND AI Robotics, Inc., a U.S. public company incorporated in Delaware. For more information, visit

www.xtend.me

.

About JFB Construction Holdings

JFB Construction Holdings (Nasdaq: JFB) is a real estate development and construction company that has provided general contracting and construction management services in 36 U.S. states. For more information, visit the company’s SEC filings at

www.sec.gov

.

Forward-Looking Statements

This communication contains, and oral statements made from time to time by our representatives may contain, forward-looking statements within the meaning of the Private Securities Litigation Reform Act of 1995, Section 27A of the Securities Act of 1933, as amended (the “Securities Act”), and Section 21E of the Securities Exchange Act of 1934, as amended. These forward-looking statements generally include statements regarding the anticipated impact of recently announced U.S. tariffs on imported drones and drone components, XTEND’s ability to scale U.S. manufacturing at its XFAB facility, XTEND’s relationships with U.S.-based manufacturers, its ability to build a network of U.S. manufacturing at scale, and their anticipated contribution to increased production, XTEND’s expansion into the private security market and the anticipated benefits of U.S.-based, NDAA-compliant manufacturing in that market, the potential transaction between XTEND Reality Expansion Ltd. (“XTEND”) and JFB Construction Holdings (“JFB”), including statements regarding the expected impacts and benefits of the potential transaction, the timing of the transaction closing, and strategic initiatives for XTEND AI Robotics, Inc. (“NewCo”) following the closing. All statements other than statements of historical facts contained in this communication may be forward-looking statements. In some cases, you can identify forward-looking statements by terms such as “may,” “will,” “outlook,” “should,” “expects,” “plans,” “anticipates,” “could,” “intends,” “targets,” “projects,” “contemplates,” “believes,” “estimates,” “predicts,” “potential” or “continue” or the negative of these terms or other similar expressions.

The forward-looking statements in this communication are only predictions. XTEND’s and JFB’s management have based these forward-looking statements largely on their current expectations and projections about future events and financial trends that management believes may affect its business, financial condition and results of operations. These statements are neither promises nor guarantees and involve known and unknown risks, uncertainties and other important factors that may cause actual results, performance or achievements to be materially different from what is expressed or implied by the forward-looking statements, including, but not limited to: the ultimate scope, duration, and implementation of recently announced tariffs on imported drones and components, and their impact on XTEND’s costs, competitive position, and customers; the proposed transaction with JFB may not be consummated, or may not close on the anticipated timeline; there may be difficulties integrating the two companies and realizing the expected benefits of the transaction; XTEND’s ability to complete the continued development of, and scale U.S.-based manufacturing at XFAB to meet increased demand; XTEND’s ability to maintain and expand its relationships with U.S.-based manufacturers, to build a network of U.S.-based manufacturing at scale, and to realize the expected benefits of these relationships; XTEND’s ability to successfully expand into the private security market; XTEND’s dependence on a limited number of defense and governmental security customers for a substantial portion of its business; significant delays or reductions in appropriations, XTEND’s programs and certain government funding and programs more broadly, including as a result of a prolonged continuing resolution and/or government shutdown, and/or related to the global security environment or other global events; increased competition within XTEND’s and JFB’s markets; changes in procurement and other U.S. and foreign laws, including changes through executive orders and tariff actions, contract terms and practices applicable to our industry; disruptions in supply chains and the cost of components and materials; cyber and other security threats or disruptions faced by XTEND and JFB, its customers or its suppliers and other partners; and XTEND’s ability to innovate, develop new products and technologies, and maintain technologies to meet the needs of XTEND’s customers. In addition, a number of important factors could cause JFB’s, XTEND’s or NewCo’s actual future results and other future circumstances to differ materially from those expressed in any forward-looking statements, including but not limited to those important factors discussed in the section entitled “Risk Factors” in the registration statement on Form S-4 filed by JFB and NewCo, as any such factors may be updated from time to time in other filings with the Securities and Exchange Commission (the “SEC”), which are available on the SEC’s website at

https://www.sec.gov

and on XTEND’s investor relations site at

https://www.xtend.me/newsroom

and JFB’s investor relations site at

https://investors.jfbconstruction.net/

. Forward-looking statements speak only as of the date they are made and, except as may be required under applicable law, neither XTEND nor JFB undertakes any obligation to update or revise any forward-looking statements, whether as a result of new information, future events or otherwise.

Important Information for Investors and Stockholders

This communication is for informational purposes only and is not intended to, and does not, constitute an offer to sell or the solicitation of an offer to buy any securities or a solicitation of any vote or approval, nor shall there be any issuance or sale of securities in any jurisdiction in which such offer, solicitation or sale would be unlawful prior to registration or qualification under the securities laws of any such jurisdiction. Investors and security holders of XTEND and JFB are urged to read the information statement/prospectus and registration statement on Form S-4, and any other document that has been or will be filed with the SEC in connection with the proposed transaction, carefully and in their entirety, because they contain important information. Investors and security holders will be able to obtain free copies of these documents through the website maintained by the SEC at

https://www.sec.gov

, or free of charge on JFB’s website at

https://investors.jfbconstruction.net/

.

JFB Construction Holdings Contact:

CORE IR

Mike Mason

516-222-2560


[email protected]

XTEND Media Contact:

Headline Media

Sarah Small

929-255-1449


[email protected]

XTEND Investor Relations:

MZ North America

Shannon Devine


[email protected]


203-741-8811

Free Training

Source link

NurExone Announces Binding MOU with Made Scientific for U.S. GMP Manufacturing and Commercial Supply Partnership


The Signed MOU Targets Initial GMP Exosome Batches in H1 2027 to Support NurExone’s Clinical Pipeline and Planned Commercial Production

TORONTO and HAIFA, Israel, Aug. 13, 2026 (GLOBE NEWSWIRE) — NurExone Biologic Inc. (“NurExone” or the “Company“) (TSXV: NRX, OTCQB: NRXBF, FSE: J90), a biotechnology company developing exosome-based regenerative therapies, today announced that its wholly owned U.S. subsidiary, Exo-Top Inc. (“Exo-Top“), together with the Company, has signed a binding memorandum of understanding (“MOU“) with Made Scientific, Inc. (“Made Scientific”) to establish an exclusive U.S. Good Manufacturing Practice (“GMP”) manufacturing and commercial exosome supply partnership to support NurExone’s clinical and commercial activities.

The proposed partnership brings together two companies with a shared vision for building scalable U.S. manufacturing infrastructure to support exosome-based therapeutics and commercial exosome products – two rapidly growing markets.

Made Scientific is a U.S.-based cell therapy contract development and manufacturing organization (“CDMO“) which operates a 60,000-square-foot U.S. FDA and EU GMP Annex 1 compliant facility in Princeton, New Jersey.

The parties intend to immediately begin the transfer of NurExone technology in parallel with negotiation of a definitive partnership agreement, with a target of initiating first GMP exosome batches in H1 2027.

Get the latest news


delivered to your inbox

Sign up for The Manila Times newsletters

By signing up with an email address, I acknowledge that I have read and agree to the Terms of Service and Privacy Policy.

“Partnering with highly regarded organizations is essential to building world-class manufacturing around novel therapeutic approaches, including exosome-based therapies,” said Dr. Lior Shaltiel, Chief Executive Officer of NurExone. “This allows us to focus on what we do best and create shareholder value, while working with specialized partners to support execution. Made Scientific is an ideal strategic partner because of its manufacturing capabilities, operational expertise, and shared long-term vision. Together, we have an opportunity to establish a U.S. manufacturing and commercialization platform to accelerate NurExone’s therapeutic pipeline, including lead candidate ExoPTEN, while creating a foundation for company revenue, commercial growth and leadership in the emerging exosome market.”

Syed T. Husain, Chairman and CEO of Made Scientific, commented, “NurExone has developed a differentiated exosome platform with significant clinical and commercial potential. This collaboration combines NurExone’s innovative bone marrow-derived exosome platform with Made Scientific’s manufacturing and regulatory expertise, creating an integrated pathway to bring exosome-based therapies from development through commercial supply.”

The proposed collaboration builds on NurExone’s broader manufacturing strategy, including bioprocess optimization with Novasign GmbH announced on July 30, 2026. Together, these initiatives are intended to strengthen the infrastructure supporting both NurExone’s therapeutic pipeline and future commercial exosome activities, positioning the Company for long-term, sustainable commercial success.

Under the binding MOU, Made Scientific will serve as NurExone’s exclusive U.S. partner for the manufacturing and aseptic fill-finish of NurExone’s bone marrow-derived exosomes. The MOU contemplates that the definitive agreement, if executed, will feature an initial term of five (5) years, with options for successive five-year renewals. If the parties do not execute a definitive agreement within six months of MOU execution, the MOU and ongoing obligations, including exclusivity grants, will automatically terminate, subject to specified surviving obligations.

Update Regarding BioXtek Letter of Intent

The Company also announced that Exo-Top has mutually agreed with Florida-based BioXtek Inc. (“BioXtek”) not to proceed with the non-binding Letter of Intent (“LOI“) previously announced on April 7, 2026. This decision follows NurExone’s strategic pivot to consolidate its U.S. GMP exosome manufacturing infrastructure under the proposed collaboration with Made Scientific. NurExone and BioXtek intend to explore potential collaborative business opportunities outside of direct production in the near future.

About Made Scientific

Made Scientific is a leading U.S.-based cell therapy contract development and manufacturing organization (CDMO) specializing in the development, manufacturing, and release of autologous and allogeneic cell therapy products for clinical- and commercial-supply. Headquartered in Princeton, New Jersey, Made Scientific combines the agility of a specialist CDMO with the deep technical expertise to deliver reliable and scalable solutions, supported by their long-term strategic backer, GC Corporation, a global leader in the pharmaceutical and biotechnology sectors. For more information, visit www.madescientific.com.

About NurExone

NurExone is a TSX Venture Exchange (“TSXV”), OTCQB, and Frankfurt-listed biotech company focused on developing regenerative exosome-based therapies for central nervous system injuries. Its lead product, ExoPTEN, has demonstrated strong preclinical data supporting clinical potential in treating acute spinal cord and optic nerve damage. Regulatory milestones, including obtaining the Orphan Drug Designation, support the Company’s roadmap towards clinical trials in the U.S. and Europe. Commercially, the Company intends to offer solutions to companies interested in quality exosomes and minimally invasive targeted delivery systems for other indications. NurExone has established Exo-Top to anchor its North American activity and growth strategy.

For additional information and a brief interview, please watch Who is NurExone?, visit www.nurexone.com or follow NurExone on LinkedInTwitterFacebook, or YouTube.

For more information, please contact:

Dr. Lior Shaltiel

Chief Executive Officer and Director

Phone: +972-52-4803034

Email: [email protected]

Russo Partners LLC

Investor and Media Relations – United States

215 Park Ave S, Suite 1905

New York, NY 10003

Phone: 212-845-4200

Email: [email protected]

Dr. Eva Reuter

Investor Relations – Germany

Phone: +49-69-1532-5857

Email: [email protected]

FORWARD-LOOKING STATEMENTS

This press release contains “forward-looking information” and “forward-looking statements” within the meaning of applicable Canadian securities laws (collectively, “forward-looking statements”). Forward-looking statements are often, but not always, identified by words such as “may”, “will”, “should”, “could”, “expect”, “plan”, “intend”, “anticipate”, “believe”, “estimate”, “potential”, “target”, “designed to”, “goal”, “subject to”, “contemplate” and similar expressions, or statements that events, conditions or results “may”, “could”, “would”, “should” or “will” occur or be achieved.

Forward-looking statements in this press release include, without limitation, statements relating to: the proposed collaboration with Made Scientific; the negotiation, execution, timing and terms of any definitive agreement; the expected scope, objectives and potential benefits of the MOU and proposed definitive agreement; the technology transfer, process establishment, manufacturing, aseptic fill-finish, quality, regulatory, commercial supply and distribution activities contemplated by the MOU; the target timing for initiating first GMP exosome batches; the ability of the parties to complete due diligence, approve SOWs, enter into definitive documentation, satisfy applicable technical, quality, regulatory, commercial, securities law and stock exchange requirements, and operationalize the proposed collaboration; the potential role of Made Scientific as a U.S. manufacturing partner; the potential use of the proposed collaboration to support NurExone’s clinical pipeline, Exo-Top activities, potential future commercial exosome activities and broader manufacturing strategy; the expected relationship between the proposed collaboration, Exo-Top and the Company’s previously announced bioprocess optimization initiative with Novasign; the potential commercialization of exosome products in jurisdictions where legally permitted; the potential exploration of business opportunities with BioXtek outside of direct production; and the Company’s development, regulatory, manufacturing, commercialization and platform opportunities.

Forward-looking statements are based on management’s current expectations and assumptions as of the date of this press release, including assumptions regarding: the ability of NurExone, Exo-Top and Made Scientific to proceed with the MOU and negotiate and enter into a definitive agreement on acceptable terms, or at all; the successful completion of due diligence; the approval and performance of applicable SOWs; the continued willingness and ability of each party to proceed with the proposed collaboration; the availability of required personnel, capital, materials, equipment, manufacturing capacity, cleanroom availability, quality systems, technical information and third-party services on commercially reasonable terms; the ability to complete technology transfer, process establishment, scale-up, quality-control and release activities; the continued accuracy and relevance of the Company’s manufacturing, scientific, regulatory and commercial plans; the ability to satisfy applicable regulatory, securities law, stock exchange and commercial requirements; the ability to maintain required intellectual property, confidentiality and regulatory protections; and the absence of material adverse technical, regulatory, commercial, legal, market, financing or operational developments.

Forward-looking statements are subject to known and unknown risks, uncertainties and other factors that may cause actual results, performance or achievements to differ materially, including, without limitation: the risk that a definitive agreement with Made Scientific may not be entered into on the timeline contemplated or at all; the risk that the MOU may terminate if a definitive agreement is not executed within the six-month period contemplated by the MOU; the risk that the proposed collaboration may not proceed as currently contemplated or may be terminated, delayed or restructured; due diligence, negotiation, documentation, SOW approval and approval risks; technology transfer, manufacturing scale-up, process development, quality-control, batch release, supply chain, raw material, equipment, facility, cleanroom availability, storage, logistics and cost risks; regulatory review, clinical development and commercialization risks; the risk that products may not be approved, authorized, commercially viable or legally marketable in one or more jurisdictions; the risk that anticipated manufacturing capacity, timelines, cost efficiencies, batch timing, commercial supply arrangements or revenue opportunities may not be achieved; risks related to exclusive arrangements, rights of first refusal or rights of first offer; dependence on third-party collaborators, manufacturers, suppliers, distributors and service providers; risks related to intellectual property, confidential information, data, know-how and regulatory documentation; financing and market risks; competition and technological change; general biotechnology and early-stage development risks; the risk that preclinical results may not be predictive of clinical results; and the risks described in the Company’s continuous disclosure filings available under its profile on SEDAR+, including the risks described under the heading “Risk Factors” in the Company’s annual information form and other public disclosure documents.

Readers are cautioned not to place undue reliance on forward-looking statements. Although the Company believes that the assumptions underlying the forward-looking statements are reasonable, forward-looking statements are not guarantees of future performance, and actual results may differ materially from those expressed or implied by such statements. Forward-looking statements are made as of the date of this press release, and the Company undertakes no obligation to update or revise any forward-looking statements, except as required by applicable law.

Neither the TSXV nor its Regulation Services Provider, as that term is defined in the policies of the TSXV, accepts responsibility for the adequacy or accuracy of this release.

Free Training

Source link

US announces billions in mining investments to strengthen manufacturing supply chains


Stock image. Image credit: Sunshine_Seeds/stock.adobe.com

The US administration has announced more than $2 billion in mining and mining-related investments, alongside more than $180 million in mining education and workforce initiatives, as it seeks to strengthen domestic manufacturing supply chains for critical materials.

In a media release, the White House said the investments were announced by President Donald Trump during a roundtable with representatives from the US mining industry on 7 August, with funding directed towards projects spanning bauxite, rare earth-free magnets, battery materials, scandium, graphite, tantalum and niobium.

According to the White House, the Department of War will invest more than $85 million in Standard Bauxite to secure supplies of refractory-grade bauxite, which is used to produce high-temperature-resistant materials for critical components and industrial applications.

A further $150 million will be invested in Minnesota-based Niron Magnetics, which is developing and producing permanent magnets without rare earth materials. 

The White House said the investment is intended to support the US defence industrial base and reduce reliance on foreign-produced rare earth magnets.

California-based Sila Nanotechnologies is set to receive $1.4 billion from the Department of War to expand production of silicon-carbon battery anodes and develop a lithium-ion battery cell manufacturing facility. 

The White House said the facilities are intended to strengthen supply chains supporting satellite operations, unmanned aerial systems and munitions.

The administration also announced a $400 million investment in Sunrise Energy Metals to develop what the White House described as a full scandium value chain, including a primary scandium mine. Scandium is used in high-heat aluminium alloys for applications including aerospace.

Additional investments include $8 million from the Export-Import Bank for 5E Advanced Materials to develop a boron deposit in California, $25 million for Westwater Resources to develop the Coosa Graphite Deposit in Alabama, and $25 million for Global Advanced Materials in Pennsylvania to develop tantalum and niobium resources.

The White House said boron, graphite, tantalum and niobium are used across industries including battery manufacturing, electronics, permanent magnets, semiconductors and steel production.

The US Development Finance Corporation will also match a $4.8 million investment in Harena Rare Earths to develop a rare earth mine in Madagascar. The White House said the project is intended to secure inputs for US manufacturing, including magnet metals and rare earths.

Alongside project funding, the administration announced more than $180 million for mining education and workforce development. The Department of Energy will invest $100 million across 14 US mining schools, with the stated aim of increasing the number of graduates with mining, minerals and related supply chain credentials.

The Department of War will provide more than $80 million to three schools for workforce development programs and technology innovation hubs focused on training geologists, metallurgists and mining engineers.

The White House said strengthening the workforce was necessary to support efforts to rebuild the country’s critical mineral supply chain, which it said had contracted over several decades while demand for critical minerals increased.

The administration has framed the investments as part of a broader effort to reduce US reliance on foreign sources of critical materials and strengthen domestic industrial and defence supply chains.

“Critical materials build and power the modern world from cars to military weaponry and factory machinery to smartphones and computers,” the White House said, adding that secure domestic capabilities across mining, processing, refining, manufacturing and recycling were important to reducing reliance on foreign countries.

The administration also pointed to measures introduced since Trump returned to office in January 2025, including executive orders covering domestic mineral production, offshore critical minerals, processed critical minerals and defence supply chains.

According to the White House, the administration has signed or approved 160 minerals deals worth almost $40 billion since January 2025. 

It also said the administration had used Section 232 measures covering industries including steel, aluminium, copper, trucks, automobiles, timber, semiconductors, critical minerals and pharmaceuticals.

The White House said these measures are intended to support domestic producers, strengthen US industrial capacity and improve national and economic security.

The latest announcement comes as the administration continues to link mining and critical mineral production with the broader goal of expanding domestic manufacturing capacity. The White House said the investments would help address supply chain vulnerabilities and support industries dependent on secure supplies of critical materials.

The figures and descriptions of the investments, as well as the administration’s assessment of their expected impact on US manufacturing and supply chains, were provided by the White House.

Free Training

Source link

SBA Announces First-Ever Critical Suppliers Prize Competition to Strengthen U.S. Manufacturing and Supply Chains – The Gilmer Mirror


WASHINGTON — Today, the U.S. Small Business Administration announced its first-ever Critical Suppliers Prize Competition, a national contest to strengthen U.S. manufacturing and critical industry supply chains by expanding capacity at key chokepoints. The competition will award up to $20 million in non‑dilutive capital, including as many as six prizes with a maximum of $6 million each, to small businesses that demonstrate the capacity to rapidly scale domestic production through measurable, enduring supply chain solutions.

“For decades, bad policy hollowed out America’s industrial base and shifted our reliance toward foreign producers and fragile overseas supply chains. Thanks to President Trump, those days are over,” said Administrator Kelly Loeffler. “The Critical Suppliers Prize Competition will unleash promising solutions to supply‑chain vulnerabilities, bring capacity and jobs back home, and rebuild strategic sectors like advanced materials, metals, and energy production. By backing innovators to deliver at scale, the Trump SBA is targeting the critical industries that will anchor America’s economic strength and national security for decades to come.”

“I urge manufacturers and critical suppliers throughout the region to seize this exciting opportunity and submit proposals for the Critical Suppliers Prize Competition,” said Regional Administrator Steven Snow, who oversees SBA operations in California, Arizona, Nevada, Hawaii, Texas, New Mexico, and Oklahoma. “Our region is home to industrial powerhouses of every size—from innovative small businesses to established manufacturers—supporting semiconductors, medical devices, precision metals, and more. Together, these job creators employ millions of Americans, strengthen our critical supply chains, and prove that American ingenuity and American-made products can compete and win anywhere in the world. This competition is a chance to expand that capacity, bring production home, and build a stronger, more secure industrial future for our country.”

Contestants must have an aligned business strategy that provides tangible deliverables on one of the following critical industry supply chain priorities:

  • Advanced Metals Manufacturing, including rapid tooling, precision casting and forging, heat treated components, strategic and critical minerals, and rare earth element recovery and magnet production.
  • Advanced Materials Manufacturing, including large format additive manufacturing and materials transformation.
  • Energy Systems, Energetics and Components, including nuclear energy, battery energy storage systems and standardization efforts.

Eligible competition contestants must meet the following criteria:

  • Private entities or teams that meet SBA’s definition of a small business.
  • Individuals submitting responses to this opportunity, including individuals representing organizations partnering with the small business applicant, must be U.S. citizens or lawful permanent residents who are at least 18 years of age at the time of their submission of an entry.
  • An individual cannot belong to more than one entry in this competition.
  • Contestants must be current and in good standing on any federal obligations.
  • Contestants must be in good standing in the jurisdiction of their state of organization.
  • Contestants must be an entity organized in and maintaining a primary place of business in the U.S. and/or its territories.
  • Contestants must be profitable and demonstrate creditworthiness.
  • Contestants must demonstrate the ability to deploy funds rapidly (within six months) and demonstrate the ability to achieve measurable increases in production or ability to implement a solution to support efficiencies in production to deliver near-term supply chain impact.
  • All members of the senior management team of a contestant must be U.S. citizens or permanent residents of the U.S. and over the age of 18.

The SBA has committed to rebuilding American supply chains and domestic manufacturing through a series of targeted initiatives. This year, the agency waived loan fees for manufacturing NAICS codes, established the first-ever loan program dedicated to American manufacturers, and modernized the Small Business Investment Company (SBIC) program so more private capital flows into critical, supply‑chain‑sensitive industries. The agency also announced a new 90% Made in America Loan Guarantee for small manufacturers and continues to promote existing programs such as the asset-based 7(a) Working Capital Pilot (WCP) Program. Through its ongoing Supplier Matchmaking Expo series and its Make Onshoring Great Again Portal, the agency has also played an active role in helping large companies source small suppliers to onshore supply chains across industries.

Contestants must submit proposals electronically to investinnovate@sba.gov. Proposals may be in the form of a company pitch deck. More information can be found at https://www.sba.gov/about-sba/priorities/sba-initiatives/critical-suppliers-prize-competition/. The deadline for submission is Aug. 21 by 11:59 p.m. ET.


About the U.S. Small Business Administration

The U.S. Small Business Administration helps power the American dream of entrepreneurship. As the leading voice for small businesses within the federal government, the SBA empowers job creators with the resources and support they need to start, grow, and expand their businesses or recover from a declared disaster. It delivers services through an extensive network of SBA field offices and partnerships with public and private organizations. To learn more, visit www.sba.gov.

About SBA Office of Investment and Innovation

The U.S. Small Business Administration (SBA) Office of Investment and Innovation (OII) leads programs to support U.S. growth-oriented small businesses and startups. These programs provide access to capital, assistance, and networks to support the success of innovation-driven small businesses. OII’s work is bolstered by public-private partnerships that drive small business growth from idea to impact. To learn more, visit https://www.sba.gov/about-sba/sba-locations/headquarters-offices/office-investment-innovation.


Free Training

Source link

3 US Manufacturing Stocks Facing Tariff Costs And Supply Chain Shifts


Uncertainty around US tariffs and trade rules is reshaping how import-heavy manufacturers plan production, manage costs, and build inventory. For investors, that mix of front-loaded imports, shifting supply chains, and volatile freight costs can create both pressure and opportunity in selected stocks that are closely exposed to this news. This article looks at three large US manufacturers from an Import-Heavy US Manufacturers screener that could be affected by these developments, helping you consider whether they might fit, or be worth avoiding, in a portfolio that is sensitive to trade policy risks.

Hexcel (HXL)

Overview: Hexcel is a US materials company that supplies advanced carbon fiber composites, honeycomb structures, and engineered parts used in commercial aircraft, defense programs, space, and industrial products.

Operations: Hexcel generates most of its revenue from Composite Materials at about US$1.6b, with a further US$394.3m from Engineered Products and a reported corporate and other loss of US$92.4m.

Market Cap: US$7.5b

Hexcel provides exposure to the long-term shift toward lighter, more efficient aircraft and defense platforms. At the same time, it is directly affected by evolving US tariff policy on imported raw materials. The company is working to offset estimated tariff headwinds of about US$3m to US$4m per quarter through regional sourcing and contract pass throughs. It still faces pressure from high debt, long fixed price contracts, and heavy reliance on Airbus and Boeing. With earnings forecasts stronger than revenue growth and ongoing R&D and capacity investments, the key question is whether Hexcel’s aerospace cycle, pricing power, and tariff mitigation efforts can justify its P/E and support more durable cash flows over time.

Hexcel’s tariff headwinds, heavy Airbus and Boeing exposure, and fixed price contracts could be masking the real story around its earnings potential, so reviewing the 2 key rewards and 2 important warning signs might change how you see the stock’s risk reward profile.

NYSE:HXL Earnings & Revenue Growth as at Jul 2026NYSE:HXL Earnings & Revenue Growth as at Jul 2026

Astec Industries (ASTE)

Overview: Astec Industries builds equipment and systems for road construction, aggregates, and mining, supplying everything from asphalt and concrete plants to crushers, screens, and material handling gear used by contractors, producers, and government agencies worldwide.

Operations: Astec generates about US$893.8m of revenue from Infrastructure Solutions and US$623m from Materials Solutions, partly offset by US$39.5m of intersegment revenue.

Market Cap: US$1.3b

Astec Industries sits at the crossroads of US infrastructure spending and global trade policy, which makes it especially relevant if you are watching tariff sensitive stocks. The company has been working to offset tariff related cost pressure through pricing, dual sourcing, and reshoring where feasible. Management describes Astec as well positioned as a US manufacturer against imported competitors that may face higher duties. At the same time, investors need to weigh high debt levels, a recent one off loss of US$30.2m, and relatively low returns on equity. The potential investment case is shaped by how these factors interact with expectations for earnings and margin performance supported by infrastructure demand and higher margin parts and service revenue.

Astec Industries appears to be an import-exposed manufacturer whose tariff offsets, higher-margin parts exposure, and US footprint might be masking a very different earnings story, so it is worth reading the 4 key rewards and 2 important warning signs

NasdaqGS:ASTE Revenue & Expenses Breakdown as at Jul 2026NasdaqGS:ASTE Revenue & Expenses Breakdown as at Jul 2026

Allison Transmission Holdings (ALSN)

Overview: Allison Transmission Holdings designs and sells fully automatic transmissions and electrified propulsion systems for commercial trucks, buses, off‑highway vehicles, and U.S. defense platforms, while also supporting a large installed base through remanufactured units and aftermarket parts.

Market Cap: US$9.5b

Allison Transmission Holdings provides exposure to critical commercial and defense vehicle demand at a time when tariff uncertainty is front and center. Around 85% of its direct material spend is sourced within the USMCA region, which management says limits direct tariff cost pressure and can even support demand for its U.S. made content. Recent moves, including the Off Highway acquisition and a record US$250m CV90 transmission contract with BAE Systems, are expanding its reach into higher margin, more durable revenue streams. However, high debt, softer North America On Highway volumes, and industry electrification remain important risks to track. The key question is how this mix of contract wins, cost discipline, and tariff positioning ultimately shows up in margins, cash flow, and valuation resilience.

Allison Transmission’s mix of record defense contracts and US-sourced materials hints at a story the headline numbers do not fully explain. As a result, the full narrative for Allison Transmission Holdings might surface one risk or upside twist investors are missing

NYSE:ALSN Earnings & Revenue Growth as at Jul 2026NYSE:ALSN Earnings & Revenue Growth as at Jul 2026

The three import-heavy US manufacturers in this article are just the starting point. The full Import-Heavy US Manufacturers screener surfaces 9 more companies that each have their own tariff, sourcing, and margin story worth comparing through the Import-Heavy US Manufacturers screener. Use Simply Wall St to identify and analyze the specific catalysts, contract profiles, and trade related narratives that matter most so you can focus on the import exposed manufacturers that best fit your highest conviction ideas.

Take Control of Your Investment Journey

If Allison Transmission Holdings or any of these companies sound like a great opportunity, register for FREE with Simply Wall St and add your companies to a Watchlist to monitor the share price against the fair value the ideal entry point.
Once you’ve made your move, manage your holdings with our Portfolio Command Center that filters out the noise to deliver only the most critical, actionable updates.
Throughout your journey, our Community allows you to filter the best ideas from thousands of investor perspectives.
By uncovering hidden catalysts and risks early, you’ll accelerate your decision-making and stay one step ahead of the market.

Seeking Fresh Alternatives Beyond These Stocks?

Market momentum can change quickly, and new breakout ideas rarely stay unnoticed for long. Review these stock themes before they become widely followed to explore potential opportunities early.

  • Target steadier income streams by reviewing a curated pool of companies in the 9 dividend fortresses and see which high yield stocks still appear reasonably priced.
  • Explore the buildout of AI infrastructure by checking the carefully filtered 52 AI infrastructure stocks that highlights businesses supplying the essential tools and services for this trend.
  • Consider long term industrial demand by screening the 8 top copper producer stocks and comparing miners and producers involved in supplying one of the key metals used in electrification.

This article by Simply Wall St is general in nature. We provide commentary based on historical data
and analyst forecasts only using an unbiased methodology and our articles are not intended to be financial advice.
It does not constitute a recommendation to buy or sell any stock, and does not take account of your objectives, or your
financial situation. We aim to bring you long-term focused analysis driven by fundamental data.
Note that our analysis may not factor in the latest price-sensitive company announcements or qualitative material.
Simply Wall St has no position in any stocks mentioned.

New: Manage All Your Stock Portfolios in One Place

We’ve created the ultimate portfolio companion for stock investors, and it’s free.

• Connect an unlimited number of Portfolios and see your total in one currency
• Be alerted to new Warning Signs or Risks via email or mobile
• Track the Fair Value of your stocks

Try a Demo Portfolio for Free

Have feedback on this article? Concerned about the content? Get in touch with us directly. Alternatively, email editorial-team@simplywallst.com

Free Training

Source link

Apple $30B Broadcom US Chips Deal: Supply Chain Reshoring


Apple has announced a multi-year agreement worth more than $30 billion with longtime supplier Broadcom to design and produce custom silicon components and advanced wireless connectivity technologies entirely in the United States. This commitment will result in the production of more than 15 billion US-made chips and marks the largest single pledge under Apple’s American Manufacturing Program to date.

The deal includes a $1.5 billion expansion of Broadcom’s facility in Fort Collins, Colorado, focusing on advanced radio frequency components such as FBAR filters. It directly supports Apple’s goal of building an end-to-end silicon supply chain on American soil while creating hundreds of domestic jobs.

The Landmark Broadcom Agreement

Apple and Broadcom have collaborated for decades on components that power connectivity in iPhones, Macs, and other devices. The new agreement shifts a substantial portion of production to US facilities, moving beyond previous reliance on overseas manufacturing for these specialized parts.

Under the terms, Broadcom will supply custom chips for a wide range of Apple products through 2031. This volume represents a significant scale-up from prior arrangements and positions Broadcom as a key anchor in the domestic ecosystem.

Tim Cook highlighted the partnership’s role in American manufacturing and innovation, noting the components’ importance for performance and connectivity. Hock Tan of Broadcom emphasized the shared commitment to US-based innovation and the expansion of the Fort Collins footprint.

This agreement stands out as Apple’s largest US manufacturing commitment so far within its broader investment framework. It demonstrates how anchor customers like Apple can drive supplier investments in advanced fabrication capabilities.

Industry observers note that such deals help de-risk supply chains by localizing production of components previously sourced internationally. The scale of 15 billion chips underscores the depth of Apple’s bet on domestic capacity.

Understanding Apple’s American Manufacturing Program

Apple launched its American Manufacturing Program in 2025 as part of a $600 billion four-year US investment commitment. The program incentivizes suppliers to expand or establish manufacturing operations in the United States for components used in Apple products sold globally.

Initial partners included companies such as Corning, Coherent, GlobalWafers America, Applied Materials, Texas Instruments, Samsung, GlobalFoundries, Amkor, and Broadcom. Subsequent expansions added Bosch, Cirrus Logic, and TDK for sensors and integrated circuits.

Since its launch, the program has enabled Apple to source more than 20 billion US-made chips from 24 factories across 12 states. This momentum shows measurable progress toward reducing dependence on concentrated overseas production hubs.

The initiative also includes direct hiring plans, with Apple targeting 20,000 new US roles focused on R&D, silicon engineering, software development, and AI/machine learning. These positions complement the supplier-side job creation.

Participants benefit from Apple’s purchasing power and long-term contracts, which provide the revenue certainty needed for capital-intensive facility expansions. The program explicitly aims to create an end-to-end silicon supply chain within the country.

Expansion at Broadcom’s Fort Collins Facility

Broadcom’s existing site in Fort Collins, Colorado, will undergo a $1.5 billion modernization and expansion specifically tied to the Apple agreement. The investment targets production of advanced radio frequency components essential for wireless performance.

Key outputs include FBAR filters, which enable precise signal filtering in mobile devices, and other advanced wireless connectivity technologies. These parts support the high-speed, reliable connections required in modern smartphones and wearables.

The facility expansion will create hundreds of American jobs in manufacturing, engineering, and related roles. This localized production reduces lead times and transportation risks compared to overseas sourcing.

Fort Collins benefits from Colorado’s established semiconductor ecosystem and skilled workforce. The project aligns with state-level incentives that complement federal efforts to boost domestic chipmaking.

Modernization efforts likely incorporate updated cleanroom standards and process technologies to meet Apple’s quality and volume requirements. Such upgrades can improve yields and efficiency over time.

Apple’s Broader US Investment Strategy

The Broadcom deal forms one pillar of Apple’s $600 billion US commitment spanning manufacturing, job creation, and technology development. Additional elements include server production facilities and expanded R&D centers.

Apple has exceeded early targets by sourcing substantial volumes of US-made chips and components. This approach builds resilience against disruptions from geopolitical events or natural disasters affecting single regions.

Long-term contracts with suppliers like Broadcom provide stability that encourages further private investment in US capacity. The strategy extends beyond chips to materials, sensors, and packaging.

By anchoring demand, Apple helps attract talent and capital to the domestic semiconductor sector. This creates a virtuous cycle where increased production capacity attracts more customers and suppliers.

The overall program supports Apple’s product roadmap by securing access to components tailored for features like advanced connectivity and AI processing. Secure domestic sourcing becomes particularly valuable for sensitive technologies.

TSMC’s Arizona Fabs and Apple’s Chip Sourcing

Apple is also a major customer at TSMC’s Arizona facility, with plans to purchase well over 100 million advanced chips in 2026 alone. The first fab produces 4nm process chips, with additional fabs under construction for more advanced nodes.

TSMC Arizona represents a significant step in bringing leading-edge logic manufacturing to the US. Apple’s commitment as the largest customer there helps anchor the site’s viability and expansion.

Production from Arizona complements the Broadcom RF and wireless components. Together they illustrate progress toward a more complete domestic supply chain for Apple’s silicon needs.

Challenges remain, including the need for advanced packaging capabilities that are still largely located overseas. Plans for packaging facilities at the Arizona site aim to address this gap over time.

Apple’s diversified approach—pairing TSMC Arizona with Broadcom Colorado and other partners—reduces single-point dependencies. This multi-supplier model enhances overall resilience.

The Geopolitical Drivers Behind Reshoring

Global tensions, particularly around Taiwan and China, have accelerated efforts to diversify semiconductor supply chains. Apple’s moves reflect a strategic response to risks of disruption in concentrated production regions.

US policy, including the CHIPS and Science Act and administration priorities, provides incentives and pressure for domestic investment. Apple’s announcements align with these broader national goals.

Reshoring advanced components like wireless chips helps mitigate vulnerabilities in critical technologies. Policymakers view semiconductor self-sufficiency as essential for economic and national security.

Similar pushes appear in other countries, such as South Korea’s semiconductor initiatives. South Korea’s massive semiconductor push highlights parallel global efforts to secure domestic capacity.

Apple’s strategy balances commercial interests with geopolitical realities. Long-term contracts signal commitment that encourages suppliers to invest despite higher US operating costs.

Enhancing Supply Chain Resilience in the AI Era

Enhancing Supply Chain Resilience in the AI Era

Explosive demand for AI hardware has intensified competition for advanced chips and components. Apple’s investments help ensure steady supply for its own AI-enabled devices and services.

Localized production of RF and connectivity chips reduces exposure to shipping delays, tariffs, or export controls. This matters for products requiring consistent high-volume availability.

The AI boom drives needs for specialized silicon, including custom accelerators and efficient wireless modules. US-based manufacturing supports faster iteration and customization.

Broader industry trends show Big Tech companies pursuing similar localization strategies. Secure supply chains become a competitive advantage in an era of rapid technological change.

Apple’s approach demonstrates how major purchasers can catalyze ecosystem development. By committing volume, the company makes US facilities economically viable for specialized production.

Economic Benefits: Jobs and Regional Development

The Broadcom expansion alone supports hundreds of new jobs in Colorado. Broader AMP efforts have already contributed to job growth across multiple states through supplier investments.

High-skill manufacturing and engineering roles in semiconductors offer strong wages and long-term career paths. These positions help revitalize regional economies with advanced industry clusters.

Apple’s direct hiring of 20,000 US employees focuses on innovation roles that complement manufacturing. Silicon engineering and AI development create high-value employment.

Indirect effects include demand for supporting services, training programs, and infrastructure. Semiconductor clusters often spur additional economic activity in surrounding areas.

Quantifiable impacts include the sourcing of over 20 billion US-made chips since the program’s start. This volume translates into sustained supplier revenues and workforce stability.

Technical Details: RF Components and Wireless Tech

FBAR filters represent a specialized technology for separating radio frequency signals with high precision. These components are critical for 5G/6G connectivity, Wi-Fi performance, and interference management in compact devices.

Advanced wireless connectivity technologies from the Fort Collins facility will support evolving standards in Apple’s product lineup. Integration with custom silicon enables optimized power efficiency and speed.

Producing these parts domestically allows tighter collaboration between Apple designers and Broadcom engineers. Proximity can accelerate development cycles for next-generation features.

The $1.5 billion investment likely funds updated equipment for higher throughput and yield improvements. Such upgrades are necessary to meet Apple’s rigorous quality standards at scale.

These components play a foundational role in device performance, often unseen by consumers but essential for reliability. Their US production strengthens the overall technology stack.

Challenges in Scaling US Semiconductor Production

US manufacturing costs remain higher than in established Asian hubs due to labor, energy, and regulatory factors. Long-term contracts help offset these differences but do not eliminate them entirely.

Building a complete ecosystem requires not only fabs but also materials suppliers, equipment makers, and packaging capabilities. Gaps persist in some upstream and downstream segments.

Talent shortages in specialized semiconductor engineering pose ongoing hurdles. Apple’s hiring plans and supplier expansions aim to address this through training and attraction programs.

Timelines for new facilities and process qualifications can span years. Rapid scaling to meet AI-driven demand requires sustained investment and policy support.

While progress is evident, full independence from global supply chains remains distant. Hybrid models combining domestic and international production will likely persist.

Lessons for Other Tech Companies

Apple’s model shows the power of large-scale, multi-year purchase commitments to drive supplier investments. Smaller firms can pursue similar strategies through consortia or government-backed initiatives.

Diversifying across multiple US locations and partners reduces risk compared to single-site reliance. The combination of TSMC Arizona and Broadcom Colorado illustrates this principle.

Engagement with federal and state incentive programs amplifies private capital. Companies evaluating reshoring should map available CHIPS Act funding and tax credits early.

Focus on high-value, specialized components yields quicker wins than attempting to replicate entire overseas ecosystems overnight. RF and wireless technologies represent one such targeted area.

Transparency in announcements, as seen with Apple’s news releases, builds stakeholder confidence and attracts further partnerships. Clear metrics like chip volumes and job numbers help track progress.

Future Implications for Global Supply Chains

Apple’s $30 billion commitment signals a lasting shift toward regionalized production for critical technologies. Other major tech firms are likely to follow with comparable announcements.

Over time, increased US capacity could influence global pricing, lead times, and innovation patterns. Domestic fabs may prioritize certain process nodes or component types.

Continued policy support will determine the pace of further expansion. Sustained incentives and trade frameworks that favor domestic sourcing will be key.

Consumers may eventually see more “Made in USA” labeling on components, though final assembly often remains international. The focus remains on securing the silicon foundation.

This trend contributes to a more distributed global semiconductor landscape, potentially improving overall system resilience against future shocks.

Practical Advice for Businesses Monitoring These Trends

Supply chain professionals should track Apple and peer announcements for signals on capacity availability and pricing trends. Early engagement with new US suppliers can secure allocations.

Companies reliant on wireless or RF components may explore partnerships with Broadcom or similar domestic players. Long-term contracts similar to Apple’s can provide stability.

Monitor TSMC Arizona output and packaging developments for opportunities in advanced logic chips. Diversification across US and allied-nation sources reduces exposure.

Invest in workforce development programs to build internal expertise in semiconductor-adjacent skills. Talent pipelines will be critical as capacity grows.

Evaluate total cost of ownership, including resilience benefits, when comparing domestic versus offshore sourcing options. Short-term premiums may deliver long-term risk mitigation.

Conclusion

Conclusion

Apple’s $30 billion Broadcom agreement represents a concrete advancement in US semiconductor localization. Combined with TSMC Arizona sourcing and the wider American Manufacturing Program, it builds meaningful domestic capacity for critical components.

While challenges around costs, talent, and ecosystem completeness remain, the scale of commitments demonstrates feasibility. The AI era’s demand pressures make such investments strategically timely.

Businesses across tech and manufacturing can draw lessons on using purchasing power to shape supply chains. Continued momentum will depend on sustained private and public sector alignment.

This development strengthens America’s position in a vital industry and offers a model for secure, resilient production in an interconnected world.

Free Training

Source link

Dorman Stock And 2 U.S. Manufacturing Picks for a Tariff Driven Supply Chain Shift


Potential U.S. tariffs on Canadian goods and tighter rules on forced labour are putting a spotlight on where companies source and build their products. For investors, that creates both risk and opportunity, as supply chains tied to Canada could face higher costs while more U.S. domestic manufacturing becomes relatively more attractive. This article looks at how that backdrop connects to three stocks from a U.S. Domestic Manufacturing Stocks screener that appear exposed to this news. You will see how each company might be positioned, and why some investors may see reasons to pay closer attention now.

ZJK Industrial (ZJK)

Overview: ZJK Industrial is a Shenzhen based manufacturer of precision fasteners and metal parts, supplying screws, bolts, CNC machined parts, SMT and PVD products used in sectors such as new energy vehicles, smartphones, wearables, drones and 5G equipment across China, the U.S. and other markets.

Operations: ZJK Industrial generates about US$56.1 million in revenue from metal fasteners and related products, with most sales coming from China (US$32.45 million), followed by Taiwan (US$16.48 million) and smaller contributions from Singapore, America and other regions.

Market Cap: US$124.1 million

Investors looking at U.S. focused manufacturing themes may find ZJK Industrial interesting because it combines exposure to end markets such as AI servers, industrial robotics and EVs with a relatively low P/E of 12.2x and an 18.2% net margin. Earnings growth has been very strong recently, and recent product launches in higher value fasteners for automated production lines indicate demand for more precise components. At the same time, volatility, high non cash earnings and an inexperienced board underline that this is not a low risk stock. With the company currently underperforming the broader U.S. market despite strong recent financials, the gap between its potential and its current share price story is what may catch investors’ attention.

Strong recent earnings, an 18.2% net margin and a 12.2x P/E suggest ZJK Industrial might not be priced for its full story yet. The 4 key rewards and 2 important warning signs (1 is major!) could reveal what the current share price might be missing.

NasdaqCM:ZJK P/E Ratio as at Jul 2026NasdaqCM:ZJK P/E Ratio as at Jul 2026

Dorman Products (DORM)

Overview: Dorman Products supplies replacement and upgrade auto parts for cars, trucks and specialty vehicles, selling everything from engine and undercar components to electronics and hardware through major aftermarket retailers, distributors and dealers in the U.S. and abroad.

Operations: Dorman Products generates about US$1.71b of revenue from Light Duty parts, US$238.7m from Heavy Duty and US$205.7m from Specialty Vehicle products, with roughly US$1.99b of total sales coming from the United States and US$160.5m from other markets.

Market Cap: US$4.17b

Dorman Products sits at the intersection of an aging U.S. vehicle fleet, recurring demand for essential replacement parts and a global trade system where tariffs can reshape cost and competitive pressures. The company’s focus on aftermarket parts that drivers need to keep vehicles on the road, plus a pipeline of higher margin proprietary parts, helps support earnings quality even as net margins and ROE are modest and last year’s earnings declined 11.3%. Recent debt refinancing and share buybacks suggest management is confident about cash flow, yet reliance on external borrowing and ongoing tariff uncertainty remain important watchpoints. With potential U.S. tariffs lifting the relative appeal of domestically focused suppliers, the key consideration is how much of that potential is already reflected in Dorman’s share price story.

Dorman Products appears to be a steady operator whose earnings dip, modest margins and recent refinancing may be masking something more interesting in its story. The analysis report for Dorman Products could show what the tariff and cash flow puzzle is really pointing to next.

DORM Discounted Cash Flow as at Jul 2026DORM Discounted Cash Flow as at Jul 2026

TriMas (TRS)

Overview: TriMas is a U.S. based manufacturer that supplies dispensing and closure packaging, as well as steel gas cylinders, to consumer, industrial, aerospace and defense customers worldwide through brands such as Rieke, Rapak and Norris Cylinder.

Operations: TriMas generates most of its revenue from Packaging at about US$547.1 million, with Specialty Products contributing around US$114.4 million.

Market Cap: US$1.50b

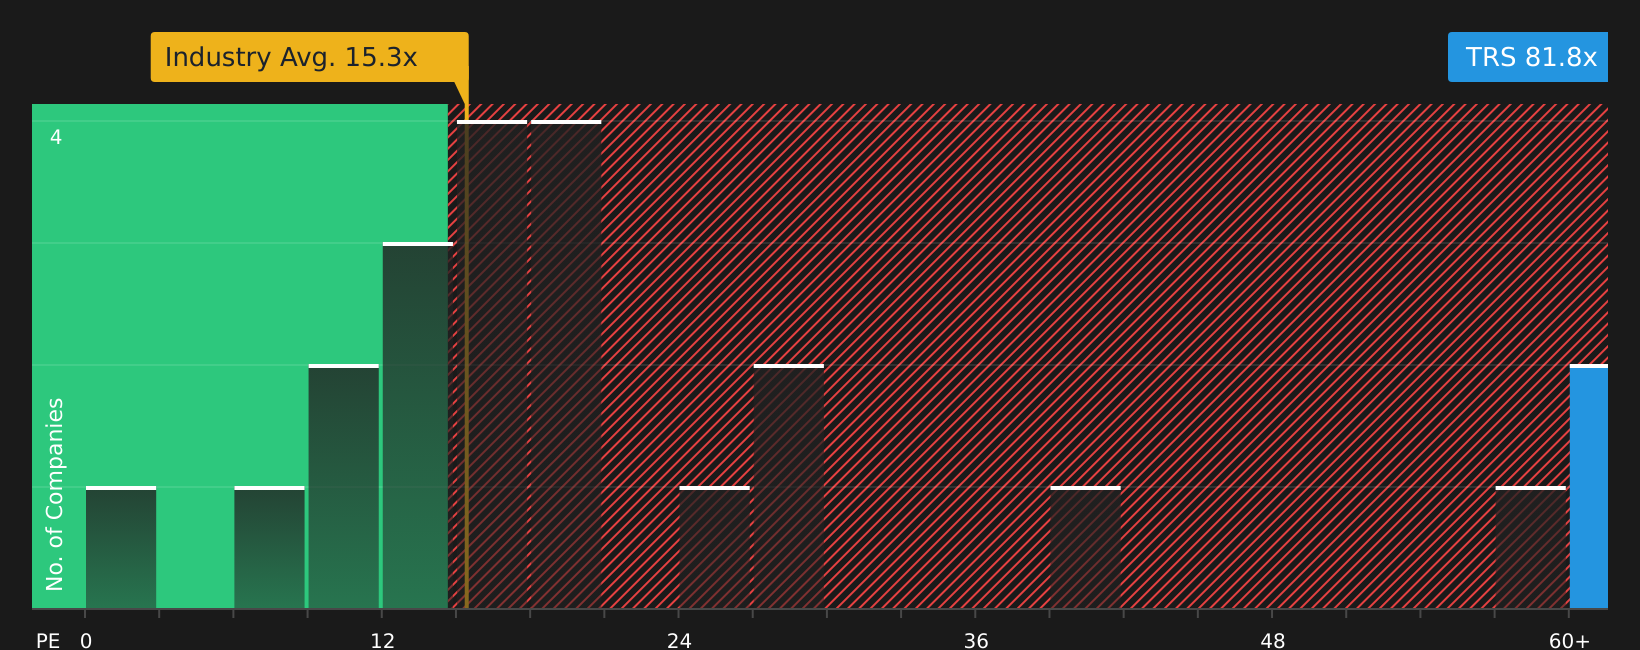
TriMas stands out in this U.S. Domestic Manufacturing Stocks screener because it links a largely U.S. oriented industrial footprint to packaging and gas cylinder products that are used across everyday consumer and industrial applications. This comes at a time when tariffs on imported goods and forced labour rules are pushing buyers to reassess where and how they source. The company is working on margin improvement through automation and integration of past acquisitions, is running an active buyback and dividend program, and management is already repositioning supply chains to limit tariff exposure. At the same time, a very high P/E, reliance on external borrowing and exposure to changing tariff policies and cyclical end markets mean investors need to look closely at what is driving the recent earnings jump and whether today’s valuation fully reflects the risks in the story.

TriMas’ high P/E, active buybacks and repositioned supply chains suggest that the current valuation story may be missing a key angle. The 3 key rewards and 2 important warning signs could surface the one risk reward twist that really matters next.

NasdaqGS:TRS P/E Ratio as at Jul 2026NasdaqGS:TRS P/E Ratio as at Jul 2026

The three stocks in this article are just a starting point, and the full U.S. Domestic Manufacturing Stocks screener surfaces 32 more U.S. focused manufacturers that may have equally compelling stories tied to tariffs, supply chains and domestic production. Use Simply Wall St to identify and analyze the specific catalysts, financial traits and risk profiles that matter to you so you can focus on the highest conviction ideas in this theme.

Take Control of Your Investment Journey

If Dorman Products or any of these companies sound like a great opportunity, register for FREE with Simply Wall St and add your companies to a Watchlist to monitor the share price against the fair value the ideal entry point.
Once you’ve made your move, manage your holdings with our Portfolio Command Center that filters out the noise to deliver only the most critical, actionable updates.
Throughout your journey, our Community allows you to filter the best ideas from thousands of investor perspectives.
By uncovering hidden catalysts and risks early, you’ll accelerate your decision-making and stay one step ahead of the market.

Seeking Alternatives Before Everyone Else?

Fresh stock ideas can gain momentum quickly, and the best entry points often get caught by early movers. Tap into under the radar opportunities before the crowd and act now.

  • Spot potential early breakouts in smaller companies with solid balance sheets by scanning the curated 18 high quality undiscovered gems while they are still flying under most investors’ radars.
  • Position ahead of possible shifts in energy and infrastructure by tracking curated 89 nuclear energy infrastructure stocks that could move as sentiment changes, while the best entries are still on offer.
  • Ride long term compounding income by reviewing a hand picked 9 dividend fortresses list that focuses on consistency and resilience before yields start dropping toward the crowd’s favorites.

This article by Simply Wall St is general in nature. We provide commentary based on historical data
and analyst forecasts only using an unbiased methodology and our articles are not intended to be financial advice.
It does not constitute a recommendation to buy or sell any stock, and does not take account of your objectives, or your
financial situation. We aim to bring you long-term focused analysis driven by fundamental data.
Note that our analysis may not factor in the latest price-sensitive company announcements or qualitative material.
Simply Wall St has no position in any stocks mentioned.

New: Manage All Your Stock Portfolios in One Place

We’ve created the ultimate portfolio companion for stock investors, and it’s free.

• Connect an unlimited number of Portfolios and see your total in one currency
• Be alerted to new Warning Signs or Risks via email or mobile
• Track the Fair Value of your stocks

Try a Demo Portfolio for Free

Have feedback on this article? Concerned about the content? Get in touch with us directly. Alternatively, email editorial-team@simplywallst.com

Free Training

Source link

U.S. Manufacturing Expands at Fastest Pace Since July 2021 Amid War-Related Supply Concerns – News and Statistics


Jun 25, 2026

U.S. manufacturing expanded in June at its fastest pace since July 2021, according to S&P Global. The firm reported on Tuesday that war-related supply concerns drove new orders to a four-year high.

In contrast, the service sector experienced sluggish growth in output and new orders, with S&P Global attributing this to resistance against rising prices and low consumer confidence. Excluding the pandemic period, factory job cuts reached their highest level since 2009.

S&P Global Market Intelligence Chief Business Economist Chris Williamson commented that the further decline in employment in manufacturing was most worrying, driven by concerns over rising raw material costs and the durability of demand. He noted that factory growth continues to be temporarily supported by inventory building due to supply fears.

Overall U.S. business activity rose in June for the third consecutive month, S&P Global said, with its composite index increasing to 52.2—a five-month high—from 51.5 in May. However, the rate of growth remained below the level seen before the start of the war with Iran on February 28.

The June survey indicated an ongoing split in the economy, with sluggish service sector growth contrasting with a solid manufacturing expansion. Service providers frequently cited elevated prices, higher interest rates, and low confidence among business and consumer customers. The service sector fuels more than 75% of U.S. economic growth.

Amid signs of weakness, several economists have reduced their growth estimates for this year. The National Association for Business Economics (NABE) reported on Monday that a panel of its economists trimmed their median forecast for gross domestic product growth this year to 2% from 2.4% in March. The economists echoed the S&P Global survey findings, noting the harm to the outlook from persistent war.

KPMG Senior Economist Yelena Maleyev, chair of the NABE survey, stated that geopolitical conflict remains the top downside concern. She added that for the first time in over a year, an end to the wars in Ukraine and the Middle East outranked productivity gains as the leading upside risk.

According to Williamson, jagged progress toward resolution of the Iran war has lifted spirits among manufacturers and service providers. He said that brighter news out of the Middle East helped restore some confidence among U.S. businesses in June. Still, he indicated that current output levels are consistent with the economy struggling to grow much faster than a 1% annualized rate in the second quarter.

  1. 1. INTRODUCTION

    Making Data-Driven Decisions to Grow Your Business

    1. REPORT DESCRIPTION
    2. RESEARCH METHODOLOGY AND THE AI PLATFORM
    3. DATA-DRIVEN DECISIONS FOR YOUR BUSINESS
    4. GLOSSARY AND SPECIFIC TERMS
  2. 2. EXECUTIVE SUMMARY

    A Quick Overview of Market Performance

    1. KEY FINDINGS
    2. MARKET TRENDS This Chapter is Available Only for the Professional EditionPRO
  3. 3. MARKET OVERVIEW

    Understanding the Current State of The Market and its Prospects

    1. MARKET SIZE: HISTORICAL DATA (2012–2025) AND FORECAST (2026–2035)
    2. CONSUMPTION BY COUNTRY: HISTORICAL DATA (2012–2025) AND FORECAST (2026–2035)
    3. MARKET FORECAST TO 2035
  4. 4. MOST PROMISING PRODUCTS FOR DIVERSIFICATION

    Finding New Products to Diversify Your Business

    1. TOP PRODUCTS TO DIVERSIFY YOUR BUSINESS
    2. BEST-SELLING PRODUCTS
    3. MOST CONSUMED PRODUCTS
    4. MOST TRADED PRODUCTS
    5. MOST PROFITABLE PRODUCTS FOR EXPORT
  5. 5. MOST PROMISING SUPPLYING COUNTRIES

    Choosing the Best Countries to Establish Your Sustainable Supply Chain

    1. TOP COUNTRIES TO SOURCE YOUR PRODUCT
    2. TOP PRODUCING COUNTRIES
    3. TOP EXPORTING COUNTRIES
    4. LOW-COST EXPORTING COUNTRIES
  6. 6. MOST PROMISING OVERSEAS MARKETS

    Choosing the Best Countries to Boost Your Export

    1. TOP OVERSEAS MARKETS FOR EXPORTING YOUR PRODUCT
    2. TOP CONSUMING MARKETS
    3. UNSATURATED MARKETS
    4. TOP IMPORTING MARKETS
    5. MOST PROFITABLE MARKETS
  7. 7. PRODUCTION

    The Latest Trends and Insights into The Industry

    1. PRODUCTION VOLUME AND VALUE: HISTORICAL DATA (2012–2025) AND FORECAST (2026–2035)
    2. PRODUCTION BY COUNTRY: HISTORICAL DATA (2012–2025) AND FORECAST (2026–2035)
  8. 8. IMPORTS

    The Largest Import Supplying Countries

    1. IMPORTS: HISTORICAL DATA (2012–2025) AND FORECAST (2026–2035)
    2. IMPORTS BY COUNTRY: HISTORICAL DATA (2012–2025) AND FORECAST (2026–2035)
    3. IMPORT PRICES BY COUNTRY: HISTORICAL DATA (2012–2025) AND FORECAST (2026–2035)
  9. 9. EXPORTS

    The Largest Destinations for Exports

    1. EXPORTS: HISTORICAL DATA (2012–2025) AND FORECAST (2026–2035)
    2. EXPORTS BY COUNTRY: HISTORICAL DATA (2012–2025) AND FORECAST (2026–2035)
    3. EXPORT PRICES BY COUNTRY: HISTORICAL DATA (2012–2025) AND FORECAST (2026–2035)
  10. 10. PROFILES OF MAJOR PRODUCERS

    The Largest Producers on The Market and Their Profiles

  11. 11. COUNTRY PROFILES

    The Largest Markets And Their Profiles

    This Chapter is Available Only for the Professional Edition
    PRO

    1. 11.1

      United States

      • Market Size
      • Production
      • Imports
      • Exports
    2. 11.2

      China

      • Market Size
      • Production
      • Imports
      • Exports
    3. 11.3

      Japan

      • Market Size
      • Production
      • Imports
      • Exports
    4. 11.4

      Germany

      • Market Size
      • Production
      • Imports
      • Exports
    5. 11.5

      United Kingdom

      • Market Size
      • Production
      • Imports
      • Exports
    6. 11.6

      France

      • Market Size
      • Production
      • Imports
      • Exports
    7. 11.7

      Brazil

      • Market Size
      • Production
      • Imports
      • Exports
    8. 11.8

      Italy

      • Market Size
      • Production
      • Imports
      • Exports
    9. 11.9

      Russian Federation

      • Market Size
      • Production
      • Imports
      • Exports
    10. 11.10

      India

      • Market Size
      • Production
      • Imports
      • Exports
    11. 11.11

      Canada

      • Market Size
      • Production
      • Imports
      • Exports
    12. 11.12

      Australia

      • Market Size
      • Production
      • Imports
      • Exports
    13. 11.13

      Republic of Korea

      • Market Size
      • Production
      • Imports
      • Exports
    14. 11.14

      Spain

      • Market Size
      • Production
      • Imports
      • Exports
    15. 11.15

      Mexico

      • Market Size
      • Production
      • Imports
      • Exports
    16. 11.16

      Indonesia

      • Market Size
      • Production
      • Imports
      • Exports
    17. 11.17

      Netherlands

      • Market Size
      • Production
      • Imports
      • Exports
    18. 11.18

      Turkey

      • Market Size
      • Production
      • Imports
      • Exports
    19. 11.19

      Saudi Arabia

      • Market Size
      • Production
      • Imports
      • Exports
    20. 11.20

      Switzerland

      • Market Size
      • Production
      • Imports
      • Exports
    21. 11.21

      Sweden

      • Market Size
      • Production
      • Imports
      • Exports
    22. 11.22

      Nigeria

      • Market Size
      • Production
      • Imports
      • Exports
    23. 11.23

      Poland

      • Market Size
      • Production
      • Imports
      • Exports
    24. 11.24

      Belgium

      • Market Size
      • Production
      • Imports
      • Exports
    25. 11.25

      Argentina

      • Market Size
      • Production
      • Imports
      • Exports
    26. 11.26

      Norway

      • Market Size
      • Production
      • Imports
      • Exports
    27. 11.27

      Austria

      • Market Size
      • Production
      • Imports
      • Exports
    28. 11.28

      Thailand

      • Market Size
      • Production
      • Imports
      • Exports
    29. 11.29

      United Arab Emirates

      • Market Size
      • Production
      • Imports
      • Exports
    30. 11.30

      Colombia

      • Market Size
      • Production
      • Imports
      • Exports
    31. 11.31

      Denmark

      • Market Size
      • Production
      • Imports
      • Exports
    32. 11.32

      South Africa

      • Market Size
      • Production
      • Imports
      • Exports
    33. 11.33

      Malaysia

      • Market Size
      • Production
      • Imports
      • Exports
    34. 11.34

      Israel

      • Market Size
      • Production
      • Imports
      • Exports
    35. 11.35

      Singapore

      • Market Size
      • Production
      • Imports
      • Exports
    36. 11.36

      Egypt

      • Market Size
      • Production
      • Imports
      • Exports
    37. 11.37

      Philippines

      • Market Size
      • Production
      • Imports
      • Exports
    38. 11.38

      Finland

      • Market Size
      • Production
      • Imports
      • Exports
    39. 11.39

      Chile

      • Market Size
      • Production
      • Imports
      • Exports
    40. 11.40

      Ireland

      • Market Size
      • Production
      • Imports
      • Exports
    41. 11.41

      Pakistan

      • Market Size
      • Production
      • Imports
      • Exports
    42. 11.42

      Greece

      • Market Size
      • Production
      • Imports
      • Exports
    43. 11.43

      Portugal

      • Market Size
      • Production
      • Imports
      • Exports
    44. 11.44

      Kazakhstan

      • Market Size
      • Production
      • Imports
      • Exports
    45. 11.45

      Algeria

      • Market Size
      • Production
      • Imports
      • Exports
    46. 11.46

      Czech Republic

      • Market Size
      • Production
      • Imports
      • Exports
    47. 11.47

      Qatar

      • Market Size
      • Production
      • Imports
      • Exports
    48. 11.48

      Peru

      • Market Size
      • Production
      • Imports
      • Exports
    49. 11.49

      Romania

      • Market Size
      • Production
      • Imports
      • Exports
    50. 11.50

      Vietnam

      • Market Size
      • Production
      • Imports
      • Exports
  12. LIST OF TABLES

    1. Key Findings In 2025
    2. Market Volume, In Physical Terms: Historical Data (2012–2025) and Forecast (2026–2035)
    3. Market Value: Historical Data (2012–2025) and Forecast (2026–2035)
    4. Per Capita Consumption, by Country, 2022–2025
    5. Production, In Physical Terms, By Country: Historical Data (2012–2025) and Forecast (2026–2035)
    6. Imports, In Physical Terms, By Country: Historical Data (2012–2025) and Forecast (2026–2035)
    7. Imports, In Value Terms, By Country: Historical Data (2012–2025) and Forecast (2026–2035)
    8. Import Prices, By Country: Historical Data (2012–2025) and Forecast (2026–2035)
    9. Exports, In Physical Terms, By Country: Historical Data (2012–2025) and Forecast (2026–2035)
    10. Exports, In Value Terms, By Country: Historical Data (2012–2025) and Forecast (2026–2035)
    11. Export Prices, By Country: Historical Data (2012–2025) and Forecast (2026–2035)
  13. LIST OF FIGURES

    1. Market Volume, In Physical Terms: Historical Data (2012–2025) and Forecast (2026–2035)
    2. Market Value: Historical Data (2012–2025) and Forecast (2026–2035)
    3. Consumption, by Country, 2025
    4. Market Volume Forecast to 2035
    5. Market Value Forecast to 2035
    6. Market Size and Growth, By Product
    7. Average Per Capita Consumption, By Product
    8. Exports and Growth, By Product
    9. Export Prices and Growth, By Product
    10. Production Volume and Growth
    11. Exports and Growth
    12. Export Prices and Growth
    13. Market Size and Growth
    14. Per Capita Consumption
    15. Imports and Growth
    16. Import Prices
    17. Production, In Physical Terms: Historical Data (2012–2025) and Forecast (2026–2035)
    18. Production, In Value Terms: Historical Data (2012–2025) and Forecast (2026–2035)
    19. Production, by Country, 2025
    20. Production, In Physical Terms, by Country: Historical Data (2012–2025) and Forecast (2026–2035)
    21. Imports, In Physical Terms: Historical Data (2012–2025) and Forecast (2026–2035)
    22. Imports, In Value Terms: Historical Data (2012–2025) and Forecast (2026–2035)
    23. Imports, In Physical Terms, By Country, 2025
    24. Imports, In Physical Terms, By Country: Historical Data (2012–2025) and Forecast (2026–2035)
    25. Imports, In Value Terms, By Country: Historical Data (2012–2025) and Forecast (2026–2035)
    26. Import Prices, By Country: Historical Data (2012–2025) and Forecast (2026–2035)
    27. Exports, In Physical Terms: Historical Data (2012–2025) and Forecast (2026–2035)
    28. Exports, In Value Terms: Historical Data (2012–2025) and Forecast (2026–2035)
    29. Exports, In Physical Terms, By Country, 2025
    30. Exports, In Physical Terms, By Country: Historical Data (2012–2025) and Forecast (2026–2035)
    31. Exports, In Value Terms, By Country: Historical Data (2012–2025) and Forecast (2026–2035)
    32. Export Prices, By Country: Historical Data (2012–2025) and Forecast (2026–2035)

Free Training

Source link

U.S. Manufacturing Expands as Supply Chain Pressures Rise


BIRMINGHAM, Mich. — U.S. manufacturing activity expanded in May at its fastest pace in four years as companies increased inventories ahead of potential supply disruptions and rising costs tied to the war with Iran, according to S&P Global data.

S&P Global’s flash U.S. manufacturing purchasing managers’ index rose to 55.3 in May from 54.5 in April, marking the strongest reading since May 2022. A reading above 50 indicates expansion.

The increase was driven largely by manufacturers building inventories to protect against possible shortages, higher prices and supply chain disruptions. Input inventories climbed to an 11-month high, while supplier delivery times worsened as companies accelerated purchasing activity.

S&P Global said factory input costs reached their highest level since June 2022, while manufacturers also raised output prices.

Manufacturing employment increased modestly.


Looking for quick answers on assembly and manufacturing topics?


Try Ask ASM, our new smart AI search tool.


Ask ASM

Free Training

Source link

Mondelez Integrates AI and Automation in Supply Chain and Manufacturing Overhaul – News and Statistics


May 19, 2026

Mondelez International has announced plans to integrate automation and artificial intelligence at up to five distribution centers that support its direct-store-delivery network, while also overhauling a portion of its U.S. manufacturing footprint, according to a company earnings call.

Speaking on an April 28 earnings call, EVP, COO and CFO Luca Zaramella explained that the automated fulfillment centers are expected to help the snack and confectionery company reach points of sale more quickly, reduce inventory, and lower costs across the 55 branches served by those centers.

In manufacturing, Zaramella stated that approximately 60% of the U.S. network has already been modernized. However, some plants within the remaining 40% operate with high waste and at a productivity level that is below expectations. He noted that certain facilities will need to focus on simpler production lines instead of complex, state-of-the-art lines, allowing the company to play to each plant’s strengths.

Mondelez also aims to cut expenses by bringing in-house the manufacturing of product lines currently handled by co-manufacturers, which Zaramella said will save a significant amount of money. Additionally, the company plans to bring all packaging for mixed packs of cookies and crackers in-house, a move Zaramella described as important for competing in the club channel, as it removes rigidity and inefficiency from the current system.

The supply chain update on the earnings call followed an earlier announcement by executives that Mondelez had launched a multiyear supply chain improvement program for its U.S. biscuits operations. Chairman and CEO Dirk Van de Put stated at the Consumer Analyst Group of New York Conference in February that the program is expected to boost capacity for biscuit, cake, and pastry production, modernize packaging capabilities, and increase network flexibility. Van de Put anticipated that the company would begin realizing the benefits of these enhancements at the start of 2027.

Mondelez is currently halfway through a $1.2 billion, multi-year overhaul of its supply chain and ERP system. The project was launched in 2024 and is planned to roll out in phases until completion in 2028.

  1. 1. INTRODUCTION

    Making Data-Driven Decisions to Grow Your Business

    1. REPORT DESCRIPTION
    2. RESEARCH METHODOLOGY AND THE AI PLATFORM
    3. DATA-DRIVEN DECISIONS FOR YOUR BUSINESS
    4. GLOSSARY AND SPECIFIC TERMS
  2. 2. EXECUTIVE SUMMARY

    A Quick Overview of Market Performance

    1. KEY FINDINGS
    2. MARKET TRENDS This Chapter is Available Only for the Professional EditionPRO
  3. 3. MARKET OVERVIEW

    Understanding the Current State of The Market and its Prospects

    1. MARKET SIZE: HISTORICAL DATA (2012–2025) AND FORECAST (2026–2035)
    2. CONSUMPTION BY COUNTRY: HISTORICAL DATA (2012–2025) AND FORECAST (2026–2035)
    3. MARKET FORECAST TO 2035
  4. 4. MOST PROMISING PRODUCTS FOR DIVERSIFICATION

    Finding New Products to Diversify Your Business

    1. TOP PRODUCTS TO DIVERSIFY YOUR BUSINESS
    2. BEST-SELLING PRODUCTS
    3. MOST CONSUMED PRODUCTS
    4. MOST TRADED PRODUCTS
    5. MOST PROFITABLE PRODUCTS FOR EXPORT
  5. 5. MOST PROMISING SUPPLYING COUNTRIES

    Choosing the Best Countries to Establish Your Sustainable Supply Chain

    1. TOP COUNTRIES TO SOURCE YOUR PRODUCT
    2. TOP PRODUCING COUNTRIES
    3. TOP EXPORTING COUNTRIES
    4. LOW-COST EXPORTING COUNTRIES
  6. 6. MOST PROMISING OVERSEAS MARKETS

    Choosing the Best Countries to Boost Your Export

    1. TOP OVERSEAS MARKETS FOR EXPORTING YOUR PRODUCT
    2. TOP CONSUMING MARKETS
    3. UNSATURATED MARKETS
    4. TOP IMPORTING MARKETS
    5. MOST PROFITABLE MARKETS
  7. 7. PRODUCTION

    The Latest Trends and Insights into The Industry

    1. PRODUCTION VOLUME AND VALUE: HISTORICAL DATA (2012–2025) AND FORECAST (2026–2035)
    2. PRODUCTION BY COUNTRY: HISTORICAL DATA (2012–2025) AND FORECAST (2026–2035)
  8. 8. IMPORTS

    The Largest Import Supplying Countries

    1. IMPORTS: HISTORICAL DATA (2012–2025) AND FORECAST (2026–2035)
    2. IMPORTS BY COUNTRY: HISTORICAL DATA (2012–2025) AND FORECAST (2026–2035)
    3. IMPORT PRICES BY COUNTRY: HISTORICAL DATA (2012–2025) AND FORECAST (2026–2035)
  9. 9. EXPORTS

    The Largest Destinations for Exports

    1. EXPORTS: HISTORICAL DATA (2012–2025) AND FORECAST (2026–2035)
    2. EXPORTS BY COUNTRY: HISTORICAL DATA (2012–2025) AND FORECAST (2026–2035)
    3. EXPORT PRICES BY COUNTRY: HISTORICAL DATA (2012–2025) AND FORECAST (2026–2035)
  10. 10. PROFILES OF MAJOR PRODUCERS

    The Largest Producers on The Market and Their Profiles

  11. 11. COUNTRY PROFILES

    The Largest Markets And Their Profiles

    This Chapter is Available Only for the Professional Edition
    PRO

    1. 11.1

      United States

      • Market Size
      • Production
      • Imports
      • Exports
    2. 11.2

      China

      • Market Size
      • Production
      • Imports
      • Exports
    3. 11.3

      Japan

      • Market Size
      • Production
      • Imports
      • Exports
    4. 11.4

      Germany

      • Market Size
      • Production
      • Imports
      • Exports
    5. 11.5

      United Kingdom

      • Market Size
      • Production
      • Imports
      • Exports
    6. 11.6

      France

      • Market Size
      • Production
      • Imports
      • Exports
    7. 11.7

      Brazil

      • Market Size
      • Production
      • Imports
      • Exports
    8. 11.8

      Italy

      • Market Size
      • Production
      • Imports
      • Exports
    9. 11.9

      Russian Federation

      • Market Size
      • Production
      • Imports
      • Exports
    10. 11.10

      India

      • Market Size
      • Production
      • Imports
      • Exports
    11. 11.11

      Canada

      • Market Size
      • Production
      • Imports
      • Exports
    12. 11.12

      Australia

      • Market Size
      • Production
      • Imports
      • Exports
    13. 11.13

      Republic of Korea

      • Market Size
      • Production
      • Imports
      • Exports
    14. 11.14

      Spain

      • Market Size
      • Production
      • Imports
      • Exports
    15. 11.15

      Mexico

      • Market Size
      • Production
      • Imports
      • Exports
    16. 11.16

      Indonesia

      • Market Size
      • Production
      • Imports
      • Exports
    17. 11.17

      Netherlands

      • Market Size
      • Production
      • Imports
      • Exports
    18. 11.18

      Turkey

      • Market Size
      • Production
      • Imports
      • Exports
    19. 11.19

      Saudi Arabia

      • Market Size
      • Production
      • Imports
      • Exports
    20. 11.20

      Switzerland

      • Market Size
      • Production
      • Imports
      • Exports
    21. 11.21

      Sweden

      • Market Size
      • Production
      • Imports
      • Exports
    22. 11.22

      Nigeria

      • Market Size
      • Production
      • Imports
      • Exports
    23. 11.23

      Poland

      • Market Size
      • Production
      • Imports
      • Exports
    24. 11.24

      Belgium

      • Market Size
      • Production
      • Imports
      • Exports
    25. 11.25

      Argentina

      • Market Size
      • Production
      • Imports
      • Exports
    26. 11.26

      Norway

      • Market Size
      • Production
      • Imports
      • Exports
    27. 11.27

      Austria

      • Market Size
      • Production
      • Imports
      • Exports
    28. 11.28

      Thailand

      • Market Size
      • Production
      • Imports
      • Exports
    29. 11.29

      United Arab Emirates

      • Market Size
      • Production
      • Imports
      • Exports
    30. 11.30

      Colombia

      • Market Size
      • Production
      • Imports
      • Exports
    31. 11.31

      Denmark

      • Market Size
      • Production
      • Imports
      • Exports
    32. 11.32

      South Africa

      • Market Size
      • Production
      • Imports
      • Exports
    33. 11.33

      Malaysia

      • Market Size
      • Production
      • Imports
      • Exports
    34. 11.34

      Israel

      • Market Size
      • Production
      • Imports
      • Exports
    35. 11.35

      Singapore

      • Market Size
      • Production
      • Imports
      • Exports
    36. 11.36

      Egypt

      • Market Size
      • Production
      • Imports
      • Exports
    37. 11.37

      Philippines

      • Market Size
      • Production
      • Imports
      • Exports
    38. 11.38

      Finland

      • Market Size
      • Production
      • Imports
      • Exports
    39. 11.39

      Chile

      • Market Size
      • Production
      • Imports
      • Exports
    40. 11.40

      Ireland

      • Market Size
      • Production
      • Imports
      • Exports
    41. 11.41

      Pakistan

      • Market Size
      • Production
      • Imports
      • Exports
    42. 11.42

      Greece

      • Market Size
      • Production
      • Imports
      • Exports
    43. 11.43

      Portugal

      • Market Size
      • Production
      • Imports
      • Exports
    44. 11.44

      Kazakhstan

      • Market Size
      • Production
      • Imports
      • Exports
    45. 11.45

      Algeria

      • Market Size
      • Production
      • Imports
      • Exports
    46. 11.46

      Czech Republic

      • Market Size
      • Production
      • Imports
      • Exports
    47. 11.47

      Qatar

      • Market Size
      • Production
      • Imports
      • Exports
    48. 11.48

      Peru

      • Market Size
      • Production
      • Imports
      • Exports
    49. 11.49

      Romania

      • Market Size
      • Production
      • Imports
      • Exports
    50. 11.50

      Vietnam

      • Market Size
      • Production
      • Imports
      • Exports
  12. LIST OF TABLES

    1. Key Findings In 2025
    2. Market Volume, In Physical Terms: Historical Data (2012–2025) and Forecast (2026–2035)
    3. Market Value: Historical Data (2012–2025) and Forecast (2026–2035)
    4. Per Capita Consumption, by Country, 2022–2025
    5. Production, In Physical Terms, By Country: Historical Data (2012–2025) and Forecast (2026–2035)
    6. Imports, In Physical Terms, By Country: Historical Data (2012–2025) and Forecast (2026–2035)
    7. Imports, In Value Terms, By Country: Historical Data (2012–2025) and Forecast (2026–2035)
    8. Import Prices, By Country: Historical Data (2012–2025) and Forecast (2026–2035)
    9. Exports, In Physical Terms, By Country: Historical Data (2012–2025) and Forecast (2026–2035)
    10. Exports, In Value Terms, By Country: Historical Data (2012–2025) and Forecast (2026–2035)
    11. Export Prices, By Country: Historical Data (2012–2025) and Forecast (2026–2035)
  13. LIST OF FIGURES

    1. Market Volume, In Physical Terms: Historical Data (2012–2025) and Forecast (2026–2035)
    2. Market Value: Historical Data (2012–2025) and Forecast (2026–2035)
    3. Consumption, by Country, 2025
    4. Market Volume Forecast to 2035
    5. Market Value Forecast to 2035
    6. Market Size and Growth, By Product
    7. Average Per Capita Consumption, By Product
    8. Exports and Growth, By Product
    9. Export Prices and Growth, By Product
    10. Production Volume and Growth
    11. Exports and Growth
    12. Export Prices and Growth
    13. Market Size and Growth
    14. Per Capita Consumption
    15. Imports and Growth
    16. Import Prices
    17. Production, In Physical Terms: Historical Data (2012–2025) and Forecast (2026–2035)
    18. Production, In Value Terms: Historical Data (2012–2025) and Forecast (2026–2035)
    19. Production, by Country, 2025
    20. Production, In Physical Terms, by Country: Historical Data (2012–2025) and Forecast (2026–2035)
    21. Imports, In Physical Terms: Historical Data (2012–2025) and Forecast (2026–2035)
    22. Imports, In Value Terms: Historical Data (2012–2025) and Forecast (2026–2035)
    23. Imports, In Physical Terms, By Country, 2025
    24. Imports, In Physical Terms, By Country: Historical Data (2012–2025) and Forecast (2026–2035)
    25. Imports, In Value Terms, By Country: Historical Data (2012–2025) and Forecast (2026–2035)
    26. Import Prices, By Country: Historical Data (2012–2025) and Forecast (2026–2035)
    27. Exports, In Physical Terms: Historical Data (2012–2025) and Forecast (2026–2035)
    28. Exports, In Value Terms: Historical Data (2012–2025) and Forecast (2026–2035)
    29. Exports, In Physical Terms, By Country, 2025
    30. Exports, In Physical Terms, By Country: Historical Data (2012–2025) and Forecast (2026–2035)
    31. Exports, In Value Terms, By Country: Historical Data (2012–2025) and Forecast (2026–2035)
    32. Export Prices, By Country: Historical Data (2012–2025) and Forecast (2026–2035)

Free Training

Source link