Bauducco® Opens Largest U.S. Manufacturing Facility in Zephyrhills, Florida, Bringing 75 Years of Brazilian Baking Craftsmanship to American Tables | Press Releases


The iconic Brazilian brand — beloved for its cookies, wafers, and specialty baked goods — makes a landmark U.S. investment, deepening its commitment to American consumers and strengthening a retail partnership built on a larger domestic production.

ZEPHYRHILLS, Fla., June 26, 2026 /PRNewswire/ — For three generations, Bauducco® has done one thing exceptionally well: make food worth sharing. Its Wafer Cookies — layered, crisp, and impossible to eat just one of — have been a staple of Brazilian households for decades. Its rich cream-filled cookies, classic butter biscuits, and beloved seasonal specialties have traveled from pantries in São Paulo to celebrations across more than 50 countries. Today, that story takes its most ambitious chapter yet.

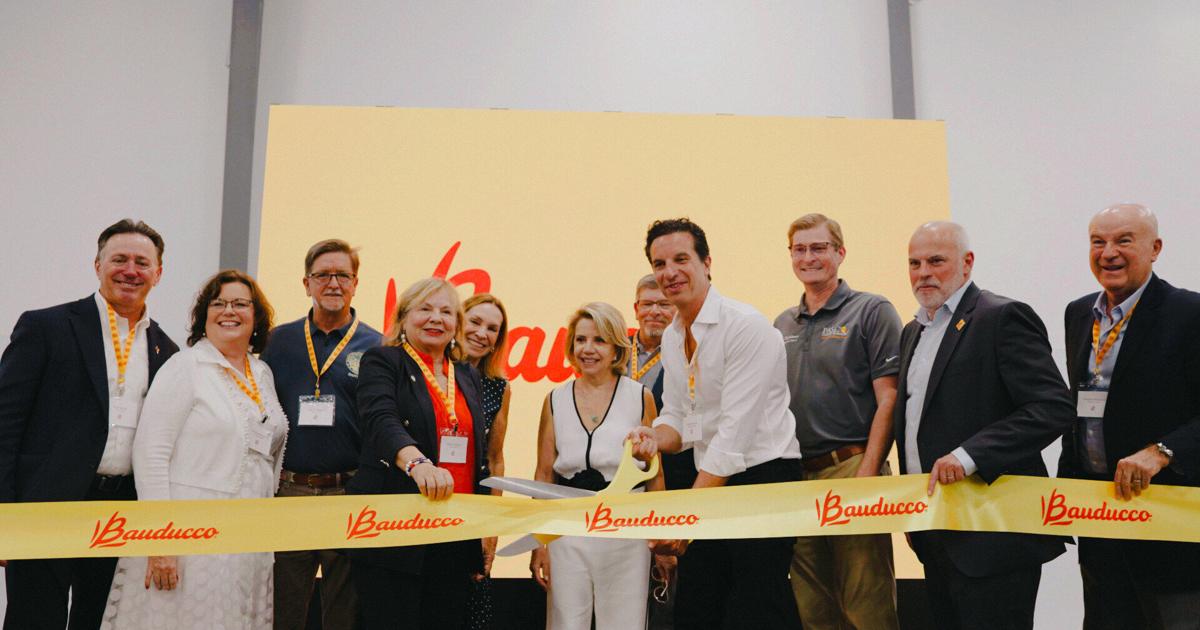
Bauducco® officially opened the doors to its largest U.S. manufacturing facility at 40334 6th Ave, in Zephyrhills, Florida. The 160,000-square-foot facility brings state-of-the-art production technology and double the manufacturing capacity previously available for the American market under one roof — streamlining the supply chain, shortening lead times, and enabling Bauducco® to respond to retail demand with greater speed and precision than ever before. The campus is designed to scale beyond 1.2 million square feet of production and distribution capacity as the company’s U.S. footprint grows, making today’s opening not just a milestone but a foundation — the most permanent and ambitious commitment Bauducco® has ever made to American consumers.

Founded in 1952, Bauducco® built its reputation on a deceptively simple idea: that the best baked goods require no shortcuts. The company’s U.S. wafer portfolio reflects that philosophy at every layer. The signature Wafer Cookies — available in chocolate, vanilla, strawberry, and coconut, and across multiple formats including a 40g single-serve, a 5oz multipack, a 9oz Family Pack, and a Sugar Free line in 5oz and 4.2oz — are made with a proprietary process that has remained largely unchanged since the brand’s earliest days. The result is a product that has achieved something rare in the snack category: genuine loyalty across generations.

The plant brings Bauducco®’s full wafer lineup under a Made in USA designation for the first time, operating at double the production capacity of what the brand previously had available for the American market. The demand signal was clear. What Bauducco® needed was the infrastructure to meet it — and now they have it.

The decision to build that infrastructure in the United States was not made quickly. For a family-owned company with deep roots in Brazil, it was a question of identity as much as strategy: was Bauducco® ready to make the expansion and build out the portfolio?

The answer, ultimately, was yes. And it’s expanding with a bet on Florida.

Zephyrhills — a growing community in the heart of Pasco County, northeast of Tampa — offered the combination of infrastructure, workforce, and community character that Bauducco®’s leadership was looking for. Pasco County’s economic development team was a key partner in making the case, helping to connect the company’s expansion vision with the resources and relationships needed to turn it into reality. The company expects the facility to employ over 600 people at full production capacity, making it one of the more significant food manufacturing employers in Pasco County.

“Bauducco’s decision to expand in Zephyrhills and create 600 jobs is a tremendous win for Pasco County. These are the kinds of opportunities that change lives and provide quality jobs for our residents while strengthening our local economy. We are proud that a globally recognized brand like Bauducco sees Pasco County as a place where it can grow and succeed, and we look forward to supporting their continued success for many years to come.” – Bill Cronin, President/CEO, Pasco Economic Development Council

The State of Florida and local government played an equally important role in bringing the project to life, with support that reflected the kind of public-private collaboration that Bauducco®’s leadership says made the decision clear.

“Today marks an exciting milestone for the City of Zephyrhills. We are proud to welcome Bauducco Foods and celebrate the opening of its largest U.S. manufacturing facility right here in Zephyrhills. Bauducco’s investment brings new high-wage jobs, strengthens our local economy, and further demonstrates the momentum taking place throughout our growing Industrial Corridor. Beyond its investment, Bauducco has already demonstrated a commitment to our city through its support of local organizations, events, and initiatives. On behalf of the Zephyrhills City Council and our residents, we are honored that this globally recognized company chose Zephyrhills for this important expansion and look forward to a long and successful partnership that will benefit our community for years to come.” – Melonie Bahr Monson, Mayor, City of Zephyrhills

For Stefano Mozzi, Bauducco®’s recently appointed Global CEO, the Zephyrhills facility is the physical expression of a strategic conviction he has championed since joining the company: that Bauducco®’s future in the United States depends on being present here in every sense of the word.

Speak to the vision behind this investment — why the U.S., why now, what this facility enables for the brand’s product quality and growth ambitions. Personal tone encouraged. Reference the brand’s 75-year legacy and what it means to bring that craftsmanship to American manufacturing. – Stefano Mozzi, Global CEO, Bauducco®

Bauducco®’s growth in the United States has been driven by retail partners who recognized early what American consumers were beginning to discover: that the brand’s commitment to quality was something worth putting on a shelf and standing behind. Those partnerships — built on consistent product performance, strong consumer pull, and a brand story that resonates across demographics — are now supported by something they have not had before: domestic production.

The Zephyrhills facility changes the equation for Bauducco®’s retail relationships in meaningful ways. Manufacturing on U.S. soil means shorter lead times, greater supply chain reliability, and the ability to respond to demand signals with speed and precision. For the retailers who have invested in the brand, it is a signal that Bauducco® is not here to test the market — it is here to serve it.

The facility also positions Bauducco® within a broader movement among major U.S. retailers to prioritize domestic sourcing and American-made products — a shift that has created new opportunities for brands willing to make the infrastructure investment to match.

“Bauducco’s investment in U.S. manufacturing is a strong example of how companies can create jobs, strengthen local communities and serve Walmart customers closer to home,” said Melody Richard, Senior Vice President, Pantry, Walmart U.S.

Bauducco® products are currently available at major retailers across the country, with the Zephyrhills facility expected to support expanded distribution and shelf presence as domestic production capacity grows. Bauducco® is the world’s largest producer of Panettone — a distinction earned over decades of perfecting the Italian-origin holiday bread that has become synonymous with the brand across more than 50 countries.

Bauducco® remains a family company. The founders’ descendants remain active in the business, and that ownership structure — with its long time horizons and personal stakes — is something company leaders say directly shaped the decision to invest at this scale in the United States.

The Zephyrhills facility is not a licensing arrangement or a co-manufacturing deal. It is Bauducco®’s own building, Bauducco®’s own lines, and Bauducco®’s own people. That distinction matters to a company that has always insisted on controlling what goes into every product it puts its name on.

For the Bauducco® family, today’s ceremony is a milestone measured not just in square footage and production capacity, but in what it represents across generations: the belief that something built carefully and honestly will always find its audience.

About Bauducco®

Founded in Brazil in 1952 by an Italian immigrant, Bauducco® is one of the world’s largest producers of baked goods, globally. Inspiring unforgettable moments with recipes crafted with innovation and passion, Bauducco®’s products are synonymous with The Feeling of Family. As a global company exporting to more than 50 countries, Bauducco® has been doing business in the U.S. for more than 20 years and has a national presence. Panettone, one of Bauducco®’s most iconic products, is a strategic player in the U.S. market, where the brand holds an 86% value share in this category. Bauducco® is the leading wafer producer nationwide. Bauducco®’s signature Panettones, Wafers, Cookies and Toasts are sold in most major retailers across the U.S. To learn more about Bauducco®, please visit www.bauducco.com and follow @bauducco.us on Instagram.


Cision View original content to download multimedia:https://www.prnewswire.com/news-releases/bauducco-opens-largest-us-manufacturing-facility-in-zephyrhills-florida-bringing-75-years-of-brazilian-baking-craftsmanship-to-american-tables-302812316.html

SOURCE Bauducco

Free Training

Source link

U.S. Manufacturing Expands at Fastest Pace Since July 2021 Amid War-Related Supply Concerns – News and Statistics


Jun 25, 2026

U.S. manufacturing expanded in June at its fastest pace since July 2021, according to S&P Global. The firm reported on Tuesday that war-related supply concerns drove new orders to a four-year high.

In contrast, the service sector experienced sluggish growth in output and new orders, with S&P Global attributing this to resistance against rising prices and low consumer confidence. Excluding the pandemic period, factory job cuts reached their highest level since 2009.

S&P Global Market Intelligence Chief Business Economist Chris Williamson commented that the further decline in employment in manufacturing was most worrying, driven by concerns over rising raw material costs and the durability of demand. He noted that factory growth continues to be temporarily supported by inventory building due to supply fears.

Overall U.S. business activity rose in June for the third consecutive month, S&P Global said, with its composite index increasing to 52.2—a five-month high—from 51.5 in May. However, the rate of growth remained below the level seen before the start of the war with Iran on February 28.

The June survey indicated an ongoing split in the economy, with sluggish service sector growth contrasting with a solid manufacturing expansion. Service providers frequently cited elevated prices, higher interest rates, and low confidence among business and consumer customers. The service sector fuels more than 75% of U.S. economic growth.

Amid signs of weakness, several economists have reduced their growth estimates for this year. The National Association for Business Economics (NABE) reported on Monday that a panel of its economists trimmed their median forecast for gross domestic product growth this year to 2% from 2.4% in March. The economists echoed the S&P Global survey findings, noting the harm to the outlook from persistent war.

KPMG Senior Economist Yelena Maleyev, chair of the NABE survey, stated that geopolitical conflict remains the top downside concern. She added that for the first time in over a year, an end to the wars in Ukraine and the Middle East outranked productivity gains as the leading upside risk.

According to Williamson, jagged progress toward resolution of the Iran war has lifted spirits among manufacturers and service providers. He said that brighter news out of the Middle East helped restore some confidence among U.S. businesses in June. Still, he indicated that current output levels are consistent with the economy struggling to grow much faster than a 1% annualized rate in the second quarter.

  1. 1. INTRODUCTION

    Making Data-Driven Decisions to Grow Your Business

    1. REPORT DESCRIPTION
    2. RESEARCH METHODOLOGY AND THE AI PLATFORM
    3. DATA-DRIVEN DECISIONS FOR YOUR BUSINESS
    4. GLOSSARY AND SPECIFIC TERMS
  2. 2. EXECUTIVE SUMMARY

    A Quick Overview of Market Performance

    1. KEY FINDINGS
    2. MARKET TRENDS This Chapter is Available Only for the Professional EditionPRO
  3. 3. MARKET OVERVIEW

    Understanding the Current State of The Market and its Prospects

    1. MARKET SIZE: HISTORICAL DATA (2012–2025) AND FORECAST (2026–2035)
    2. CONSUMPTION BY COUNTRY: HISTORICAL DATA (2012–2025) AND FORECAST (2026–2035)
    3. MARKET FORECAST TO 2035
  4. 4. MOST PROMISING PRODUCTS FOR DIVERSIFICATION

    Finding New Products to Diversify Your Business

    1. TOP PRODUCTS TO DIVERSIFY YOUR BUSINESS
    2. BEST-SELLING PRODUCTS
    3. MOST CONSUMED PRODUCTS
    4. MOST TRADED PRODUCTS
    5. MOST PROFITABLE PRODUCTS FOR EXPORT
  5. 5. MOST PROMISING SUPPLYING COUNTRIES

    Choosing the Best Countries to Establish Your Sustainable Supply Chain

    1. TOP COUNTRIES TO SOURCE YOUR PRODUCT
    2. TOP PRODUCING COUNTRIES
    3. TOP EXPORTING COUNTRIES
    4. LOW-COST EXPORTING COUNTRIES
  6. 6. MOST PROMISING OVERSEAS MARKETS

    Choosing the Best Countries to Boost Your Export

    1. TOP OVERSEAS MARKETS FOR EXPORTING YOUR PRODUCT
    2. TOP CONSUMING MARKETS
    3. UNSATURATED MARKETS
    4. TOP IMPORTING MARKETS
    5. MOST PROFITABLE MARKETS
  7. 7. PRODUCTION

    The Latest Trends and Insights into The Industry

    1. PRODUCTION VOLUME AND VALUE: HISTORICAL DATA (2012–2025) AND FORECAST (2026–2035)
    2. PRODUCTION BY COUNTRY: HISTORICAL DATA (2012–2025) AND FORECAST (2026–2035)
  8. 8. IMPORTS

    The Largest Import Supplying Countries

    1. IMPORTS: HISTORICAL DATA (2012–2025) AND FORECAST (2026–2035)
    2. IMPORTS BY COUNTRY: HISTORICAL DATA (2012–2025) AND FORECAST (2026–2035)
    3. IMPORT PRICES BY COUNTRY: HISTORICAL DATA (2012–2025) AND FORECAST (2026–2035)
  9. 9. EXPORTS

    The Largest Destinations for Exports

    1. EXPORTS: HISTORICAL DATA (2012–2025) AND FORECAST (2026–2035)
    2. EXPORTS BY COUNTRY: HISTORICAL DATA (2012–2025) AND FORECAST (2026–2035)
    3. EXPORT PRICES BY COUNTRY: HISTORICAL DATA (2012–2025) AND FORECAST (2026–2035)
  10. 10. PROFILES OF MAJOR PRODUCERS

    The Largest Producers on The Market and Their Profiles

  11. 11. COUNTRY PROFILES

    The Largest Markets And Their Profiles

    This Chapter is Available Only for the Professional Edition
    PRO

    1. 11.1

      United States

      • Market Size
      • Production
      • Imports
      • Exports
    2. 11.2

      China

      • Market Size
      • Production
      • Imports
      • Exports
    3. 11.3

      Japan

      • Market Size
      • Production
      • Imports
      • Exports
    4. 11.4

      Germany

      • Market Size
      • Production
      • Imports
      • Exports
    5. 11.5

      United Kingdom

      • Market Size
      • Production
      • Imports
      • Exports
    6. 11.6

      France

      • Market Size
      • Production
      • Imports
      • Exports
    7. 11.7

      Brazil

      • Market Size
      • Production
      • Imports
      • Exports
    8. 11.8

      Italy

      • Market Size
      • Production
      • Imports
      • Exports
    9. 11.9

      Russian Federation

      • Market Size
      • Production
      • Imports
      • Exports
    10. 11.10

      India

      • Market Size
      • Production
      • Imports
      • Exports
    11. 11.11

      Canada

      • Market Size
      • Production
      • Imports
      • Exports
    12. 11.12

      Australia

      • Market Size
      • Production
      • Imports
      • Exports
    13. 11.13

      Republic of Korea

      • Market Size
      • Production
      • Imports
      • Exports
    14. 11.14

      Spain

      • Market Size
      • Production
      • Imports
      • Exports
    15. 11.15

      Mexico

      • Market Size
      • Production
      • Imports
      • Exports
    16. 11.16

      Indonesia

      • Market Size
      • Production
      • Imports
      • Exports
    17. 11.17

      Netherlands

      • Market Size
      • Production
      • Imports
      • Exports
    18. 11.18

      Turkey

      • Market Size
      • Production
      • Imports
      • Exports
    19. 11.19

      Saudi Arabia

      • Market Size
      • Production
      • Imports
      • Exports
    20. 11.20

      Switzerland

      • Market Size
      • Production
      • Imports
      • Exports
    21. 11.21

      Sweden

      • Market Size
      • Production
      • Imports
      • Exports
    22. 11.22

      Nigeria

      • Market Size
      • Production
      • Imports
      • Exports
    23. 11.23

      Poland

      • Market Size
      • Production
      • Imports
      • Exports
    24. 11.24

      Belgium

      • Market Size
      • Production
      • Imports
      • Exports
    25. 11.25

      Argentina

      • Market Size
      • Production
      • Imports
      • Exports
    26. 11.26

      Norway

      • Market Size
      • Production
      • Imports
      • Exports
    27. 11.27

      Austria

      • Market Size
      • Production
      • Imports
      • Exports
    28. 11.28

      Thailand

      • Market Size
      • Production
      • Imports
      • Exports
    29. 11.29

      United Arab Emirates

      • Market Size
      • Production
      • Imports
      • Exports
    30. 11.30

      Colombia

      • Market Size
      • Production
      • Imports
      • Exports
    31. 11.31

      Denmark

      • Market Size
      • Production
      • Imports
      • Exports
    32. 11.32

      South Africa

      • Market Size
      • Production
      • Imports
      • Exports
    33. 11.33

      Malaysia

      • Market Size
      • Production
      • Imports
      • Exports
    34. 11.34

      Israel

      • Market Size
      • Production
      • Imports
      • Exports
    35. 11.35

      Singapore

      • Market Size
      • Production
      • Imports
      • Exports
    36. 11.36

      Egypt

      • Market Size
      • Production
      • Imports
      • Exports
    37. 11.37

      Philippines

      • Market Size
      • Production
      • Imports
      • Exports
    38. 11.38

      Finland

      • Market Size
      • Production
      • Imports
      • Exports
    39. 11.39

      Chile

      • Market Size
      • Production
      • Imports
      • Exports
    40. 11.40

      Ireland

      • Market Size
      • Production
      • Imports
      • Exports
    41. 11.41

      Pakistan

      • Market Size
      • Production
      • Imports
      • Exports
    42. 11.42

      Greece

      • Market Size
      • Production
      • Imports
      • Exports
    43. 11.43

      Portugal

      • Market Size
      • Production
      • Imports
      • Exports
    44. 11.44

      Kazakhstan

      • Market Size
      • Production
      • Imports
      • Exports
    45. 11.45

      Algeria

      • Market Size
      • Production
      • Imports
      • Exports
    46. 11.46

      Czech Republic

      • Market Size
      • Production
      • Imports
      • Exports
    47. 11.47

      Qatar

      • Market Size
      • Production
      • Imports
      • Exports
    48. 11.48

      Peru

      • Market Size
      • Production
      • Imports
      • Exports
    49. 11.49

      Romania

      • Market Size
      • Production
      • Imports
      • Exports
    50. 11.50

      Vietnam

      • Market Size
      • Production
      • Imports
      • Exports
  12. LIST OF TABLES

    1. Key Findings In 2025
    2. Market Volume, In Physical Terms: Historical Data (2012–2025) and Forecast (2026–2035)
    3. Market Value: Historical Data (2012–2025) and Forecast (2026–2035)
    4. Per Capita Consumption, by Country, 2022–2025
    5. Production, In Physical Terms, By Country: Historical Data (2012–2025) and Forecast (2026–2035)
    6. Imports, In Physical Terms, By Country: Historical Data (2012–2025) and Forecast (2026–2035)
    7. Imports, In Value Terms, By Country: Historical Data (2012–2025) and Forecast (2026–2035)
    8. Import Prices, By Country: Historical Data (2012–2025) and Forecast (2026–2035)
    9. Exports, In Physical Terms, By Country: Historical Data (2012–2025) and Forecast (2026–2035)
    10. Exports, In Value Terms, By Country: Historical Data (2012–2025) and Forecast (2026–2035)
    11. Export Prices, By Country: Historical Data (2012–2025) and Forecast (2026–2035)
  13. LIST OF FIGURES

    1. Market Volume, In Physical Terms: Historical Data (2012–2025) and Forecast (2026–2035)
    2. Market Value: Historical Data (2012–2025) and Forecast (2026–2035)
    3. Consumption, by Country, 2025
    4. Market Volume Forecast to 2035
    5. Market Value Forecast to 2035
    6. Market Size and Growth, By Product
    7. Average Per Capita Consumption, By Product
    8. Exports and Growth, By Product
    9. Export Prices and Growth, By Product
    10. Production Volume and Growth
    11. Exports and Growth
    12. Export Prices and Growth
    13. Market Size and Growth
    14. Per Capita Consumption
    15. Imports and Growth
    16. Import Prices
    17. Production, In Physical Terms: Historical Data (2012–2025) and Forecast (2026–2035)
    18. Production, In Value Terms: Historical Data (2012–2025) and Forecast (2026–2035)
    19. Production, by Country, 2025
    20. Production, In Physical Terms, by Country: Historical Data (2012–2025) and Forecast (2026–2035)
    21. Imports, In Physical Terms: Historical Data (2012–2025) and Forecast (2026–2035)
    22. Imports, In Value Terms: Historical Data (2012–2025) and Forecast (2026–2035)
    23. Imports, In Physical Terms, By Country, 2025
    24. Imports, In Physical Terms, By Country: Historical Data (2012–2025) and Forecast (2026–2035)
    25. Imports, In Value Terms, By Country: Historical Data (2012–2025) and Forecast (2026–2035)
    26. Import Prices, By Country: Historical Data (2012–2025) and Forecast (2026–2035)
    27. Exports, In Physical Terms: Historical Data (2012–2025) and Forecast (2026–2035)
    28. Exports, In Value Terms: Historical Data (2012–2025) and Forecast (2026–2035)
    29. Exports, In Physical Terms, By Country, 2025
    30. Exports, In Physical Terms, By Country: Historical Data (2012–2025) and Forecast (2026–2035)
    31. Exports, In Value Terms, By Country: Historical Data (2012–2025) and Forecast (2026–2035)
    32. Export Prices, By Country: Historical Data (2012–2025) and Forecast (2026–2035)

Free Training

Source link