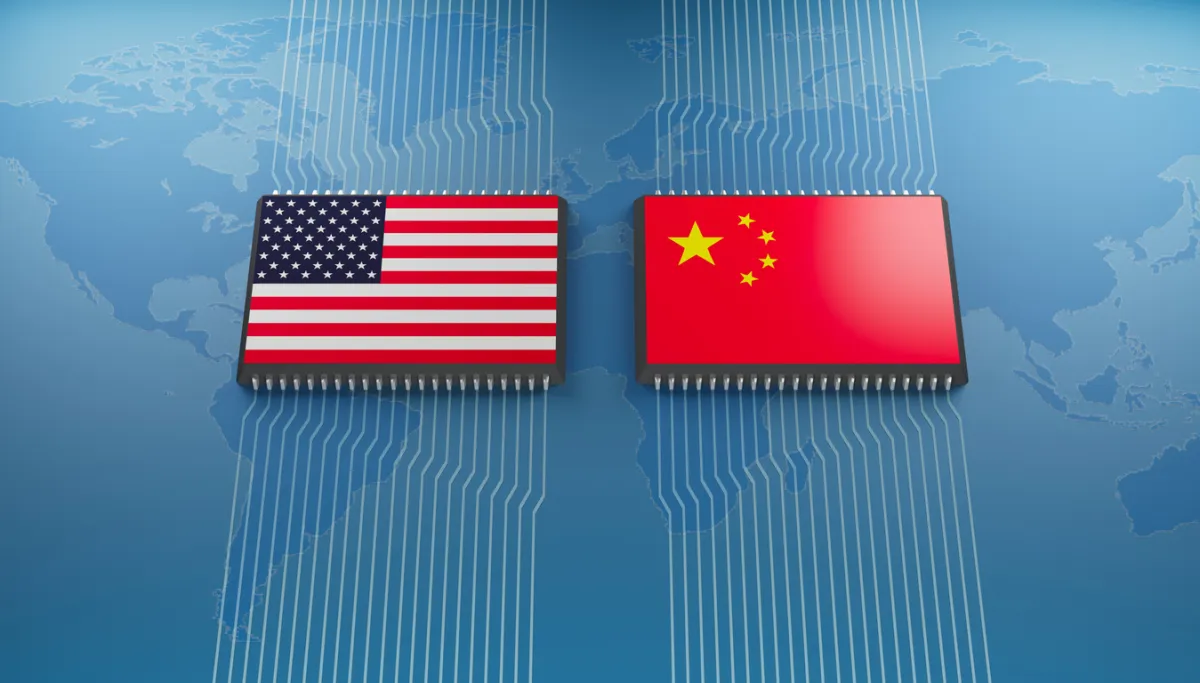


Tariffs on Canadian goods could reshape races in five battleground states


Trump’s escalating trade war with Canada could raise costs for businesses and consumers in key battleground states before voters head to the polls.

President Donald Trump’s escalating trade war with Canada is raising fresh concerns in battleground states ahead of the November midterms.

The U.S. and Canada have imposed tariffs on billions of dollars’ worth of goods, while Washington has also banned nearly $1 billion in Canadian imports, including alcohol, dairy products and motorcycles.

The latest measures took effect Sept. 29 as negotiations remain unresolved.

Trump says the tariffs will bring manufacturing back to the United States and protect American industries. But businesses could cut production, consumers could face higher prices and manufacturers could delay investments.

A FRESH MIDTERM HEADACHE FOR THE GOP JUST HIT A NATIONAL RECORD

President Donald Trump meets with Canadian Prime Minister Mark Carney in the Oval Office.

The trade fight has escalated under Trump and Canadian Prime Minister Mark Carney, with negotiations breaking down and both countries imposing new measures targeting each other’s goods. (Getty Images)

“The cost of living, cost of goods, cost of doing business is such an important factor for Americans who are going to be casting a ballot,” David Clement, policy director of the Consumer Choice Center, told Fox News Digital.

Clement identified Ohio, Illinois, Michigan, Pennsylvania and Wisconsin as among the states most exposed to Canadian retaliation because of their manufacturing, agricultural and cross-border supply chains.

“American manufacturers or American businesses who rely on Canadian inputs are going to start to feel the pain right in the lead up to going to the ballot box,” he said.

The trade fight has escalated since Canada’s retaliatory tariffs took effect in September. At a recent G20 trade ministers meeting, U.S. Trade Representative Jamieson Greer acknowledged that key issues remain unresolved.

Ohio

Ohio is among the states most vulnerable to Canadian retaliation, with roughly $2.3 billion in exports exposed, according to Clement.

The state’s machinery, transportation, minerals and metals industries depend heavily on Canadian buyers and cross-border supply chains. Tariffs could make Ohio goods more expensive and reduce demand for products made by the state’s manufacturers.

Michigan
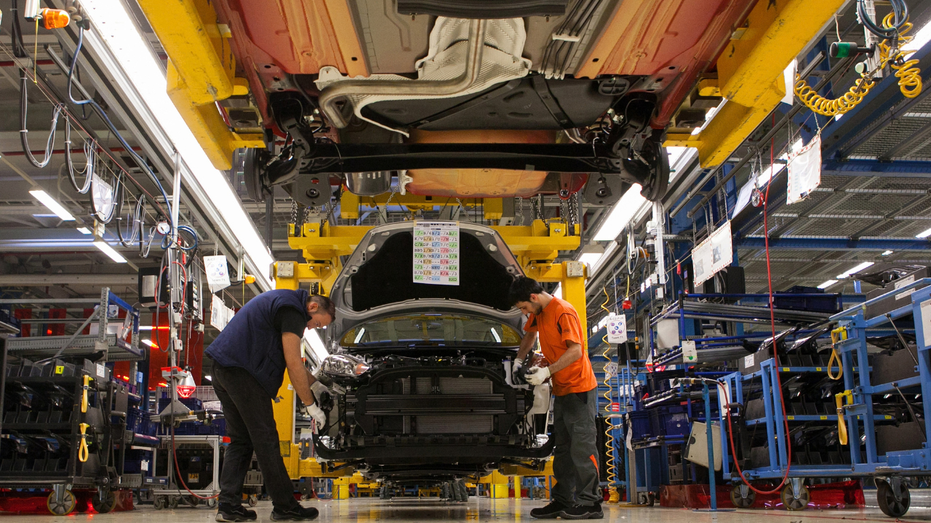
Men are seen working on a car at a Ford factory.

Michigan’s auto industry faces heightened uncertainty as tariffs threaten the deeply integrated supply chain connecting the state with Canada. (Krisztian Bocsi/Bloomberg/Getty Images)

Michigan may face the clearest risk because of its deeply integrated auto industry and close ties to neighboring Ontario.

Auto parts can cross the U.S.-Canada border multiple times before a vehicle is completed, meaning tariffs can increase costs at each stage of production.

A MUST-WIN MIDTERM STATE IS THE REAL LOSER OF TRUMP’S CANADA TRADE WAR

“Most Americans don’t know that a single component on a U.S.-assembled vehicle can cross the border upwards of eight times before it’s actually completed,” Clement said.

The stakes could rise further if the administration moves ahead with a possible 50% tariff on Canadian auto exports beginning Jan. 1 if the countries fail to reach an agreement.

Pennsylvania

Pennsylvania could have just under $1.8 billion in exports exposed, including machinery and equipment, according to Clement.

The state’s manufacturers depend on Canada as a major customer, while many also rely on Canadian inputs. That creates a double burden if tariffs make materials more expensive and finished products harder to sell.

Illinois

A banner with a portrait of U.S. President Donald Trump is displayed on the front U.S. Department of Labor Frances Perkins Building on May 30, 2026.

President Donald Trump has defended the tariffs as a way to protect American industries and bring manufacturing back to the United States. (Getty Images)

Illinois faces exposure across manufacturing, agriculture and transportation.

Its businesses sell machinery, food products and chemicals to Canada, while companies across the Midwest rely on Canadian materials and components. Tariffs could make those exports less competitive and eventually push higher production costs onto consumers.

Wisconsin

Wisconsin’s economy is closely linked to Canada through agriculture, manufacturing and food production.

The state exports dairy products, machinery and agricultural equipment. Canadian tariffs could make those goods more expensive and give Canadian buyers an incentive to seek alternatives.

Wisconsin farmers and manufacturers are particularly vulnerable because many operate on narrow margins and depend on predictable access to Canadian customers.

CLICK HERE TO GET FOX BUSINESS ON THE GO

Even if Democrats make gains in November, Clement said a change in congressional control would not necessarily end the tariffs because presidents have broad authority over trade policy.

But as the dispute continues, its impact on prices, jobs and businesses could become a decisive issue in the states that determine control of Congress.

Free Training

Source link

Gold Near $4,300: Durable Goods Data and Fed Rate Tightening Risks – News and Statistics


Sep 25, 2026

Gold continued to hold its ground near the $4,300-an-ounce level, though the metal may face further headwinds as U.S. manufacturing activity remains relatively firm, according to Kitco News.

The Commerce Department reported Friday that U.S. durable goods orders were essentially flat in August, after a revised gain of 0.9% in July. The result came in slightly above expectations, since economists on consensus had projected a decline of 0.3%.

Core durable goods orders, which exclude the transportation sector, increased 0.3% in August, following a 0.4% rise in July. Consensus estimates had pointed to a 0.4% gain.

Non-defense capital goods orders excluding aircraft climbed 1.6% in August, well above expectations for a 0.5% increase.

Adam Button, head of currency strategy at investingLive, commented that while the headline figure was flat, the core orders carry more weight for the underlying direction of the economy, describing the number as strong and supportive of a bullish economic view.

The gold market showed little major reaction to the data. Spot gold last traded at $4,298.70 an ounce, up 0.60% on the day.

Some analysts noted that gold could still struggle, as the latest manufacturing data gives the Federal Reserve more room to keep tightening interest rates to address the persistent inflation threat.

  1. 1. INTRODUCTION

    Making Data-Driven Decisions to Grow Your Business

    1. REPORT DESCRIPTION
    2. RESEARCH METHODOLOGY AND THE AI PLATFORM
    3. DATA-DRIVEN DECISIONS FOR YOUR BUSINESS
    4. GLOSSARY AND SPECIFIC TERMS
  2. 2. EXECUTIVE SUMMARY

    A Quick Overview of Market Performance

    1. KEY FINDINGS
    2. MARKET TRENDS This Chapter is Available Only for the Professional EditionPRO
  3. 3. MARKET OVERVIEW

    Understanding the Current State of The Market and its Prospects

    1. MARKET SIZE: HISTORICAL DATA (2012–2025) AND FORECAST (2026–2035)
    2. CONSUMPTION BY COUNTRY: HISTORICAL DATA (2012–2025) AND FORECAST (2026–2035)
    3. MARKET FORECAST TO 2035
  4. 4. MOST PROMISING PRODUCTS FOR DIVERSIFICATION

    Finding New Products to Diversify Your Business

    1. TOP PRODUCTS TO DIVERSIFY YOUR BUSINESS
    2. BEST-SELLING PRODUCTS
    3. MOST CONSUMED PRODUCTS
    4. MOST TRADED PRODUCTS
    5. MOST PROFITABLE PRODUCTS FOR EXPORT
  5. 5. MOST PROMISING SUPPLYING COUNTRIES

    Choosing the Best Countries to Establish Your Sustainable Supply Chain

    1. TOP COUNTRIES TO SOURCE YOUR PRODUCT
    2. TOP PRODUCING COUNTRIES
    3. TOP EXPORTING COUNTRIES
    4. LOW-COST EXPORTING COUNTRIES
  6. 6. MOST PROMISING OVERSEAS MARKETS

    Choosing the Best Countries to Boost Your Export

    1. TOP OVERSEAS MARKETS FOR EXPORTING YOUR PRODUCT
    2. TOP CONSUMING MARKETS
    3. UNSATURATED MARKETS
    4. TOP IMPORTING MARKETS
    5. MOST PROFITABLE MARKETS
  7. 7. PRODUCTION

    The Latest Trends and Insights into The Industry

    1. PRODUCTION VOLUME AND VALUE: HISTORICAL DATA (2012–2025) AND FORECAST (2026–2035)
    2. PRODUCTION BY COUNTRY: HISTORICAL DATA (2012–2025) AND FORECAST (2026–2035)
  8. 8. IMPORTS

    The Largest Import Supplying Countries

    1. IMPORTS: HISTORICAL DATA (2012–2025) AND FORECAST (2026–2035)
    2. IMPORTS BY COUNTRY: HISTORICAL DATA (2012–2025) AND FORECAST (2026–2035)
    3. IMPORT PRICES BY COUNTRY: HISTORICAL DATA (2012–2025) AND FORECAST (2026–2035)
  9. 9. EXPORTS

    The Largest Destinations for Exports

    1. EXPORTS: HISTORICAL DATA (2012–2025) AND FORECAST (2026–2035)
    2. EXPORTS BY COUNTRY: HISTORICAL DATA (2012–2025) AND FORECAST (2026–2035)
    3. EXPORT PRICES BY COUNTRY: HISTORICAL DATA (2012–2025) AND FORECAST (2026–2035)
  10. 10. PROFILES OF MAJOR PRODUCERS

    The Largest Producers on The Market and Their Profiles

  11. 11. COUNTRY PROFILES

    The Largest Markets And Their Profiles

    This Chapter is Available Only for the Professional Edition
    PRO

    1. 11.1

      United States

      • Market Size
      • Production
      • Imports
      • Exports
    2. 11.2

      China

      • Market Size
      • Production
      • Imports
      • Exports
    3. 11.3

      Japan

      • Market Size
      • Production
      • Imports
      • Exports
    4. 11.4

      Germany

      • Market Size
      • Production
      • Imports
      • Exports
    5. 11.5

      United Kingdom

      • Market Size
      • Production
      • Imports
      • Exports
    6. 11.6

      France

      • Market Size
      • Production
      • Imports
      • Exports
    7. 11.7

      Brazil

      • Market Size
      • Production
      • Imports
      • Exports
    8. 11.8

      Italy

      • Market Size
      • Production
      • Imports
      • Exports
    9. 11.9

      Russian Federation

      • Market Size
      • Production
      • Imports
      • Exports
    10. 11.10

      India

      • Market Size
      • Production
      • Imports
      • Exports
    11. 11.11

      Canada

      • Market Size
      • Production
      • Imports
      • Exports
    12. 11.12

      Australia

      • Market Size
      • Production
      • Imports
      • Exports
    13. 11.13

      Republic of Korea

      • Market Size
      • Production
      • Imports
      • Exports
    14. 11.14

      Spain

      • Market Size
      • Production
      • Imports
      • Exports
    15. 11.15

      Mexico

      • Market Size
      • Production
      • Imports
      • Exports
    16. 11.16

      Indonesia

      • Market Size
      • Production
      • Imports
      • Exports
    17. 11.17

      Netherlands

      • Market Size
      • Production
      • Imports
      • Exports
    18. 11.18

      Turkey

      • Market Size
      • Production
      • Imports
      • Exports
    19. 11.19

      Saudi Arabia

      • Market Size
      • Production
      • Imports
      • Exports
    20. 11.20

      Switzerland

      • Market Size
      • Production
      • Imports
      • Exports
    21. 11.21

      Sweden

      • Market Size
      • Production
      • Imports
      • Exports
    22. 11.22

      Nigeria

      • Market Size
      • Production
      • Imports
      • Exports
    23. 11.23

      Poland

      • Market Size
      • Production
      • Imports
      • Exports
    24. 11.24

      Belgium

      • Market Size
      • Production
      • Imports
      • Exports
    25. 11.25

      Argentina

      • Market Size
      • Production
      • Imports
      • Exports
    26. 11.26

      Norway

      • Market Size
      • Production
      • Imports
      • Exports
    27. 11.27

      Austria

      • Market Size
      • Production
      • Imports
      • Exports
    28. 11.28

      Thailand

      • Market Size
      • Production
      • Imports
      • Exports
    29. 11.29

      United Arab Emirates

      • Market Size
      • Production
      • Imports
      • Exports
    30. 11.30

      Colombia

      • Market Size
      • Production
      • Imports
      • Exports
    31. 11.31

      Denmark

      • Market Size
      • Production
      • Imports
      • Exports
    32. 11.32

      South Africa

      • Market Size
      • Production
      • Imports
      • Exports
    33. 11.33

      Malaysia

      • Market Size
      • Production
      • Imports
      • Exports
    34. 11.34

      Israel

      • Market Size
      • Production
      • Imports
      • Exports
    35. 11.35

      Singapore

      • Market Size
      • Production
      • Imports
      • Exports
    36. 11.36

      Egypt

      • Market Size
      • Production
      • Imports
      • Exports
    37. 11.37

      Philippines

      • Market Size
      • Production
      • Imports
      • Exports
    38. 11.38

      Finland

      • Market Size
      • Production
      • Imports
      • Exports
    39. 11.39

      Chile

      • Market Size
      • Production
      • Imports
      • Exports
    40. 11.40

      Ireland

      • Market Size
      • Production
      • Imports
      • Exports
    41. 11.41

      Pakistan

      • Market Size
      • Production
      • Imports
      • Exports
    42. 11.42

      Greece

      • Market Size
      • Production
      • Imports
      • Exports
    43. 11.43

      Portugal

      • Market Size
      • Production
      • Imports
      • Exports
    44. 11.44

      Kazakhstan

      • Market Size
      • Production
      • Imports
      • Exports
    45. 11.45

      Algeria

      • Market Size
      • Production
      • Imports
      • Exports
    46. 11.46

      Czech Republic

      • Market Size
      • Production
      • Imports
      • Exports
    47. 11.47

      Qatar

      • Market Size
      • Production
      • Imports
      • Exports
    48. 11.48

      Peru

      • Market Size
      • Production
      • Imports
      • Exports
    49. 11.49

      Romania

      • Market Size
      • Production
      • Imports
      • Exports
    50. 11.50

      Vietnam

      • Market Size
      • Production
      • Imports
      • Exports
  12. LIST OF TABLES

    1. Key Findings In 2025
    2. Market Volume, In Physical Terms: Historical Data (2012–2025) and Forecast (2026–2035)
    3. Market Value: Historical Data (2012–2025) and Forecast (2026–2035)
    4. Per Capita Consumption, by Country, 2022–2025
    5. Production, In Physical Terms, By Country: Historical Data (2012–2025) and Forecast (2026–2035)
    6. Imports, In Physical Terms, By Country: Historical Data (2012–2025) and Forecast (2026–2035)
    7. Imports, In Value Terms, By Country: Historical Data (2012–2025) and Forecast (2026–2035)
    8. Import Prices, By Country: Historical Data (2012–2025) and Forecast (2026–2035)
    9. Exports, In Physical Terms, By Country: Historical Data (2012–2025) and Forecast (2026–2035)
    10. Exports, In Value Terms, By Country: Historical Data (2012–2025) and Forecast (2026–2035)
    11. Export Prices, By Country: Historical Data (2012–2025) and Forecast (2026–2035)
  13. LIST OF FIGURES

    1. Market Volume, In Physical Terms: Historical Data (2012–2025) and Forecast (2026–2035)
    2. Market Value: Historical Data (2012–2025) and Forecast (2026–2035)
    3. Consumption, by Country, 2025
    4. Market Volume Forecast to 2035
    5. Market Value Forecast to 2035
    6. Market Size and Growth, By Product
    7. Average Per Capita Consumption, By Product
    8. Exports and Growth, By Product
    9. Export Prices and Growth, By Product
    10. Production Volume and Growth
    11. Exports and Growth
    12. Export Prices and Growth
    13. Market Size and Growth
    14. Per Capita Consumption
    15. Imports and Growth
    16. Import Prices
    17. Production, In Physical Terms: Historical Data (2012–2025) and Forecast (2026–2035)
    18. Production, In Value Terms: Historical Data (2012–2025) and Forecast (2026–2035)
    19. Production, by Country, 2025
    20. Production, In Physical Terms, by Country: Historical Data (2012–2025) and Forecast (2026–2035)
    21. Imports, In Physical Terms: Historical Data (2012–2025) and Forecast (2026–2035)
    22. Imports, In Value Terms: Historical Data (2012–2025) and Forecast (2026–2035)
    23. Imports, In Physical Terms, By Country, 2025
    24. Imports, In Physical Terms, By Country: Historical Data (2012–2025) and Forecast (2026–2035)
    25. Imports, In Value Terms, By Country: Historical Data (2012–2025) and Forecast (2026–2035)
    26. Import Prices, By Country: Historical Data (2012–2025) and Forecast (2026–2035)
    27. Exports, In Physical Terms: Historical Data (2012–2025) and Forecast (2026–2035)
    28. Exports, In Value Terms: Historical Data (2012–2025) and Forecast (2026–2035)
    29. Exports, In Physical Terms, By Country, 2025
    30. Exports, In Physical Terms, By Country: Historical Data (2012–2025) and Forecast (2026–2035)
    31. Exports, In Value Terms, By Country: Historical Data (2012–2025) and Forecast (2026–2035)
    32. Export Prices, By Country: Historical Data (2012–2025) and Forecast (2026–2035)

Free Training

Source link

To win the next war, America must give up consumer goods race against China


As we celebrate America’s 250th birthday, our pride in successfully reaching this milestone must be tempered by the challenge we face: ensuring a strong, secure, and resilient nation for the next 250 years and more. 

There is a clear, albeit difficult, path forward. First, revive, reconstitute, and reconfigure America’s manufacturing base. Second, within the confines of the U.S. sphere of influence (encompassing the homeland and the rest of the Americas), assemble and build critical supply chains with respect to the technology, energy, and food sectors that are vital to our economic and military security. Third, put in place a pragmatic fiscal framework that defuses the huge, ticking federal deficit bomb while encouraging private sector-driven, sustainable economic growth.

The foundation of U.S. military power is the size of America’s manufacturing base. Although the United States has the world’s largest economy, with GDP of $30.4 trillion as of 2025, the American manufacturing sector was only $2.9 trillion or about 9.5% of GDP. In sharp contrast, the size of China’s manufacturing sector was $4.8 trillion or about 25% of GDP of $19.5 trillion. Simply put, although the size of the U.S. economy was about 60% larger than China’s, the American manufacturing sector was only about 60% the size of China’s manufacturing sector.

IF AMERICA WON’T BUILD SAUDI ARABIA’S REACTORS, BEIJING WILL

It is unlikely that the United States will be able to close the manufacturing gap with China for the foreseeable future. 

According to the International Monetary Fund projections prepared in July 2026, the real rate of growth of the U.S. economy is expected to be 2.3% in 2026 and 2.2% in 2027. For the comparable periods, China’s real GDP growth rate is projected to be 4.6% and 4.1%. 

Assuming the US will grow at a real rate of 2.5% per annum (which is higher than the 1.8% annual real growth rate assumed by the Congressional Budget Office), then at the end of a decade, the size of the economy would be about $38.9 trillion. If the share of manufacturing increased to 15% of GDP by the end of a decade, the size of the U.S. manufacturing sector would amount to $5.8 trillion. 

Even if the Chinese economy grew at only 2.5% per annum (the same rate as the U.S. and significantly lower than IMF projections), and assuming there is no change in the share of the manufacturing sector’s share of the country’s economy, at the end of ten years the size of China’s manufacturing sector would be $6.3 trillion, which still would be larger than America’s manufacturing sector at that time.

So, the American manufacturing sector will have to shift its focus from consumer goods to military and dual-use products. Other countries within America’s sphere of influence would be key U.S. trade partners facilitating this transition, particularly for consumer goods.

Decoupling from the ecosystems of adversaries such as China and Russia is not a choice but an existential necessity. 

Manufacturing represents the end of the supply chain, but the intermediate and beginning stages are equally important for the integrity and security of the supply chain. After all, the supply chain is only as strong as its weakest link. 

Given the reality of a smaller American manufacturing base relative to China, the United States will have to have comparatively higher productivity driven by Artificial Intelligence and other technologies in order to produce more and better-quality military and dual-use goods with the same resources. 

The backbone of AI-driven productivity is the data centers ecosystem: land, water, and electric power. The United States has sufficient land and water and has the potential to significantly turbocharge its electric power-generating capacity. The key is to substantially expand the share of renewable nuclear fuel in the energy mix to support the huge demand for electric power that an AI-driven productivity revolution requires. 

The NIMBY backlash against data centers and nuclear power is a misguided, self-imposed constraint that will have to be addressed and overcome via the democratic political process, not by fiat. The national security dimensions of the AI revolution have yet to be seriously considered.

The rest of the Americas have the potential to supply the United States with key basic natural resources, critical minerals, fossil fuels, and agricultural products required to safeguard U.S. military and economic security.

Argentina, Bolivia, and Chile collectively have identified lithium reserves of about 64 million tons or about 40% of world identified reserves. Lithium is the key ingredient for rechargeable batteries that power electric vehicles – a sector dominated by China. 

Chile, Peru, and Mexico collectively have proved copper reserves of about 318 million tons or about 33% of world proved reserves. Copper is a basic building block of industry, including the electric power, transportation, communication, and construction sectors.

Venezuela has the world’s largest proved oil reserves of about 303.8 billion barrels. Canada has proved oil reserves of 170.3 billion barrels. Collectively, the two countries account for about 27% of world oil reserves.

Canada has proved potash reserves of about 1.1 billion tons or about 20% of world proved reserves. Potash is the main ingredient for fertilizers and critical for food security.

The quintet of Argentina, Brazil, Canada, Chile, and Mexico is an agricultural combine that guarantees food security within the U.S. sphere of influence and beyond. 

Of course, to regenerate the U.S. manufacturing base and unlock the potential of the other countries of the Americas to ensure robust supply chains from exploration, to development, to refining and processing will require the mobilization of a massive amount of private sector investment. 

The U.S. government cannot continue on its current trajectory to a fiscal meltdown that would destroy America’s capital markets, which have financed our nation’s economic growth. As of fiscal year-end 2025, the total federal debt of $37.6 trillion represented 124% of GDP of $30.4 trillion. According to projections prepared by the Congressional Budget Office, total federal debt held by the public will mushroom to 175% of GDP in 2056.

CHINA HAS ROCKS. WE HAVE LOBBYISTS. GUESS WHO’S WINNING THE CRITICAL MINERALS WAR?

It is within the power of Washington’s decision-makers to craft a pathway to fiscal resiliency. Instead of squandering the nation’s scarce resources to slay imaginary foreign dragons, it’s time to slay the real fiscal monster at home that is an imminent existential threat. 

We cannot betray our Founding Fathers. On our 250th anniversary, the legacy we must bequeath to future generations is a strong, secure and resilient America.

Samir Tata is the founder and president of International Political Risk Analytics, an advisory firm based in Reston, Virginia, and author of the book Reflections on Grand Strategy: The Great Powers in the Twenty-first Century.

Free Training

Source link

U.S. manufacturing stalls, held back by durable goods


July 17, 2026 10:06 AM, EDT

Aircraft manufacturing in Renton, Wash. (M. Scott Brauer/Bloomberg)

Key Takeaways:Toggle View of Key Takeaways

  • U.S. manufacturing production stalled in June, dragged down by a decline in durable goods such as machinery.
  • Durable goods declines, including machinery, wood products, electrical equipment and appliances, helped stall factory output despite gains in utilities and mining.
  • Capacity utilization at factories fell slightly to 75.7% as renewed U.S.-Iran hostilities raised risks for energy costs and demand.

U.S. manufacturing production stalled in June, dragged down by a decline in durable goods such as machinery.

Factory output, which accounts for three-fourths of total industrial production, was unchanged after an upwardly revised 0.1% increase in May, Federal Reserve data out July 17 showed.

The median estimate in a Bloomberg survey of economists called for a 0.1% advance.

Overall industrial production rose 0.1% for a second month. And output at utilities and mining each increased 0.4%, according to the report.

Within durables, other categories that also declined included wood products, electrical equipment and appliances.

Meanwhile, production of computer and electronic products and defense and space equipment, which both saw strong gains in the two previous months, slowed in June.

June #IndustrialProduction: Total +0.1%, Mfg. +0.0%, Utilities +0.4%, Mining +0.4%; #CapacityUtilization 76.1% https://t.co/nYuGKYaV9g #FedData

— Federal Reserve (@federalreserve) July 17, 2026

The report, showing two months of stagnation, contrasts with other recent data signaling some recovery in manufacturing. But an upturn in energy prices amid renewed hostilities between the U.S. and Iran risks driving up costs and sapping demand.

In the Fed report, capacity utilization at factories, a measure of potential output being used, fell slightly to 75.7%. The overall industrial utilization rate was unchanged.

Free Training

Source link