
Suniva raises US$825 million for 4.5GW cell manufacturing facility
Suniva raises US$825 million for 4.5GW cell manufacturing facility – PV Tech

Suniva raises US$825 million for 4.5GW cell manufacturing facility – PV Tech
Five-Year Agreement Secures 9 GWh of U.S.-Manufactured LFP Cell Supply for NeoVolta Power
Additional 9 GWh Cell Supply and Pack Purchase Arrangement, Under Which SK On Will Purchase Energy Storage Packs from NeoVolta Power From 2027 through 2031, Expanding Total Collaboration to 18 GWh
SAN DIEGO, Aug. 31, 2026 (GLOBE NEWSWIRE) — NeoVolta Inc. (NASDAQ: NEOV) (“NeoVolta” or the “Company”), a U.S.-based energy technology company delivering scalable energy storage solutions, today announced that its majority-owned subsidiary, NeoVolta Power, LLC (“NeoVolta Power”), has entered into a five-year strategic supply and manufacturing collaboration with SK On (“SK On”).
The collaboration begins with a signed agreement for SK On to supply 9 gigawatt-hours (“GWh”) of U.S.-manufactured lithium iron phosphate (“LFP”) battery cells to NeoVolta Power from 2027 through 2031. The agreement also establishes a framework for broader collaboration in which SK On will supply an additional 9 GWh of LFP cells to NeoVolta Power from 2027 through 2031, and NeoVolta Power will produce energy storage packs for purchase by SK On. Together, the initial cell-supply agreement and broader pack-manufacturing collaboration are expected to support up to 18 GWh of combined activity between the companies.
Key highlights
Get the latest news
delivered to your inbox
Sign up for The Manila Times newsletters
By signing up with an email address, I acknowledge that I have read and agree to the Terms of Service and Privacy Policy.
Strategic Collaboration
“This collaboration represents an important milestone in NeoVolta’s expansion into large-scale energy storage and the continued buildout of our U.S. manufacturing platform,” said Ardes Johnson, Chief Executive Officer of NeoVolta. “The initial agreement secures long-term access to U.S.-manufactured LFP cells for our Pendergrass production expansion, while the broader collaboration positions NeoVolta Power to manufacture energy storage packs for SK On. Together, these initiatives reinforce our strategy to build a domestic energy storage platform designed to meet growing demand for reliable, high-performance BESS solutions.”
The signed agreement establishes SK On as the primary cell supplier for NeoVolta Power’s LFP pouch-cell-based BESS products. The broader collaboration will leverage NeoVolta Power’s domestic manufacturing capabilities, with SK On supplying additional LFP cells for incorporation into battery energy storage packs designed and manufactured by NeoVolta Power and purchased by SK On.
“This partnership strengthens SK On’s position in the U.S. BESS market and brings together SK On’s U.S.-made LFP battery technology with NeoVolta Power’s growing energy storage manufacturing capabilities,” said Daejin Choi, Head of ESS Business at SK On. “We view NeoVolta Power as a strategic partner as we expand our presence in the U.S. energy storage market. By combining our respective capabilities, we will pursue new commercial opportunities and deliver competitive BESS solutions that meet evolving market needs.”
Domestic Manufacturing Platform
NeoVolta Power’s Pendergrass, Georgia facility is designed to manufacture BESS products for commercial, industrial and utility-scale applications. By pairing U.S.-manufactured LFP cells with U.S.-based battery BESS manufacturing, the Company believes its platform is positioned to serve customers seeking reliable and domestic content BESS solutions.
The Company’s initial Pendergrass production line remains on track to advance through commissioning and production-ramp activities. The multi-year strategic collaboration with SK On is expected to accelerate NeoVolta Power’s expansion from its initial Pendergrass production line to a two-line manufacturing platform targeting up to 8 GWh of annual BESS production capacity in 2028.
About NeoVolta
NeoVolta is an innovator in energy storage solutions dedicated to advancing reliable, high-performance power infrastructure for residential, commercial, and utility applications. With a focus on scalable technology, domestic manufacturing, and strategic partnerships, NeoVolta is positioned to support the accelerating transition toward resilient energy systems.
For more information, visit www.neovolta.com.
About SK On
SK On is a global leading battery & trading company committed to technological innovation for a better, sustainable future.
SK On aims to accelerate the green energy transition by leveraging its global production base and R&D capabilities, as well as its manufacturing and quality management know-how.
Headquartered in Seoul, South Korea, SK On has a worldwide presence with battery plants currently operating or in construction across the United States, Europe, and Asia.
For more information, visit: http://eng.sk-on.com/
Forward-Looking Statements
This press release contains forward-looking statements within the meaning of applicable federal securities laws. Forward-looking statements include, among other things, statements regarding anticipated battery-cell supply, future battery-pack purchases, the implementation of future order documents, production and delivery schedules, future manufacturing capacity, the potential establishment and timing of additional production lines, domestic-content and supply-chain characteristics, the availability or applicability of tax incentives and credits, customer demand, market opportunities, and the anticipated benefits and future opportunities associated with the relationship between NeoVolta Power and SK On.
Forward-looking statements are based on current expectations and assumptions and are subject to risks and uncertainties that could cause actual results to differ materially from those expressed or implied. These risks and uncertainties include, among others, risks related to the parties’ ability to finalize and implement future order documents and commercial terms; satisfy technical and product-specification requirements; execute production ramps; obtain financing; source materials; meet regulatory or tax-credit requirements; respond to changes in tariffs or raw-material prices; and other risks described in NeoVolta’s filings with the U.S. Securities and Exchange Commission. Readers are cautioned not to place undue reliance on forward-looking statements, which speak only as of the date made. NeoVolta undertakes no obligation to update these statements except as required by law.
Contacts
NEOV Investors
Bryan Baritot
Alliance Advisors IR
NEOV Media
Email: [email protected]
Phone: 800-364-5464

Reports related to this article:
Written by Eric Funderburk for IIR News Intelligence (Sugar Land, Texas)
Fuel cells, powered by either hydrogen or natural gas, are being increasingly deployed for power generation throughout the U.S., and fuel-cell manufacturers are underway with projects to help meet the increasing demand.
The use of fuel cells to provide power generation is gaining ground at sites throughout the U.S., with data centers in particular targeting the technology to decrease reliance on external power. Smaller fuel cells can be used in automotive applications.
Industrial Info Resources data show more than $4.8 billion in active power generation projects using fuel cells, although most of these are planned for the future.
The “fuel cells” umbrella is a bit broad, as the label covers both fuel cells powered directly by hydrogen as well as those that run on a supply of natural gas. The technologies have similarities, as hydrogen is the ultimate source of power for both types of cells.
Both hydrogen and natural gas fuel cells generate electricity through an electrochemical process, rather than combustion. Hydrogen-based fuel cells directly use hydrogen, with water vapor the only byproduct (in addition to heat). Natural gas fuel cells actually convert the natural gas to hydrogen, which is then used to generate electricity and releases both water vapor and carbon dioxide, although significantly less CO2 than combustion processes, as well as virtually eliminating some types of emissions such as nitrogen oxides and sulfur oxides.
Industrial Info’s fuel cell coverage of fuel cell manufacturing and their deployment for power generation includes both natural gas- and hydrogen-based fuel cell technologies.
Using fuel cells for behind-the-meter power generation is gaining ground in the U.S., and the prime recipients of this technology are data centers.
Many of the fuel cell systems that are intended for data centers are meant to run on natural gas, but one of the nation’s leading fuel cell manufacturers, Bloom Energy, provides technologies that possess substantial fuel flexibility.
It’s these flexible Bloom technologies that American Electric Power Company (AEP) plans to use at a generation facility in Hilliard, Ohio, to help power a nearby Amazon data center. Industrial Info Resources data show most of the buildings at Amazon’s Hilliard data center have been completed, and work on the final 110,000-square-foot building is planned to begin this year. Shortly after that building is finished in mid-2027, AEP is expected to put the finishing touches on a 72.91-megawatt (MW)fuel cell facility that will power a portion of the data center.
At the generation site, AEP will employ various Bloom Energy systems that are primarily meant for natural gas but fully capable of using hydrogen or biogas for a lower emissions footprint. Construction of the power generation plant is expected to begin later this year and last about a year.
Amazon also is considering a 20-MW fuel cell system using Bloom technology at a data center in Santa Clara, California, while elsewhere in Ohio, AEP is in the early planning stages for the use of a 100-MW fuel cell system to help power Cologix’s planned $8 billion hyperscale data center in Johnstown.
On the fuel-cell manufacturing side, covered by the Industrial Info Resources Global Market Intelligence (GMI) Industrial Manufacturing Project Database, many, but not all, of the current projects are based on hydrogen-focused technologies, largely the result of a number of them receiving funding from the Biden-era Inflation Reduction Act (IRA), which was primarily aimed to fund clean energy projects.
One of the leading projects to receive IRA funding broke ground earlier this year in Chesterfield County, Virginia, where Topsoe is working with joint venture partners Fluor Incorporated and ABB Incorporated to construct a 280,000-square-foot facility to produce up to 1 gigawatt (GW) per year of solid oxide electrolyzer cells, primarily fueled from green hydrogen. The plant is expected to be completed in 2028.
Most of the other fuel cell-manufacturing construction being tracked by Industrial Info Resources is for renovations and expansions of existing facilities. In the coming weeks, Bloom Energy is expected to break ground on an expansion of its manufacturing plant in Fremont, California, that will include installation of a new assembly line to boost production capacity to 2 GW per year.
Key Takeaways
About Industrial Info Resources
Industrial Info Resources (IIR) is the leading provider of industrial market intelligence. Since 1983, IIR has provided comprehensive research, news and analysis on the industrial process, manufacturing and energy related industries. IIR’s Global Market Intelligence (GMI) helps companies identify and pursue trends across multiple markets with access to real, qualified and validated plant and project opportunities. Across the world, Industrial Info Resources is tracking over 250,000 current and future projects worth $30.2 trillion (USD).
May 16, 2026
Inox Clean Energy Ltd, the renewable energy arm of the Inoxgfl Group, has finalized the purchase of Boviet Solar’s manufacturing operations in North Carolina. This information was originally reported by pv magazine India.
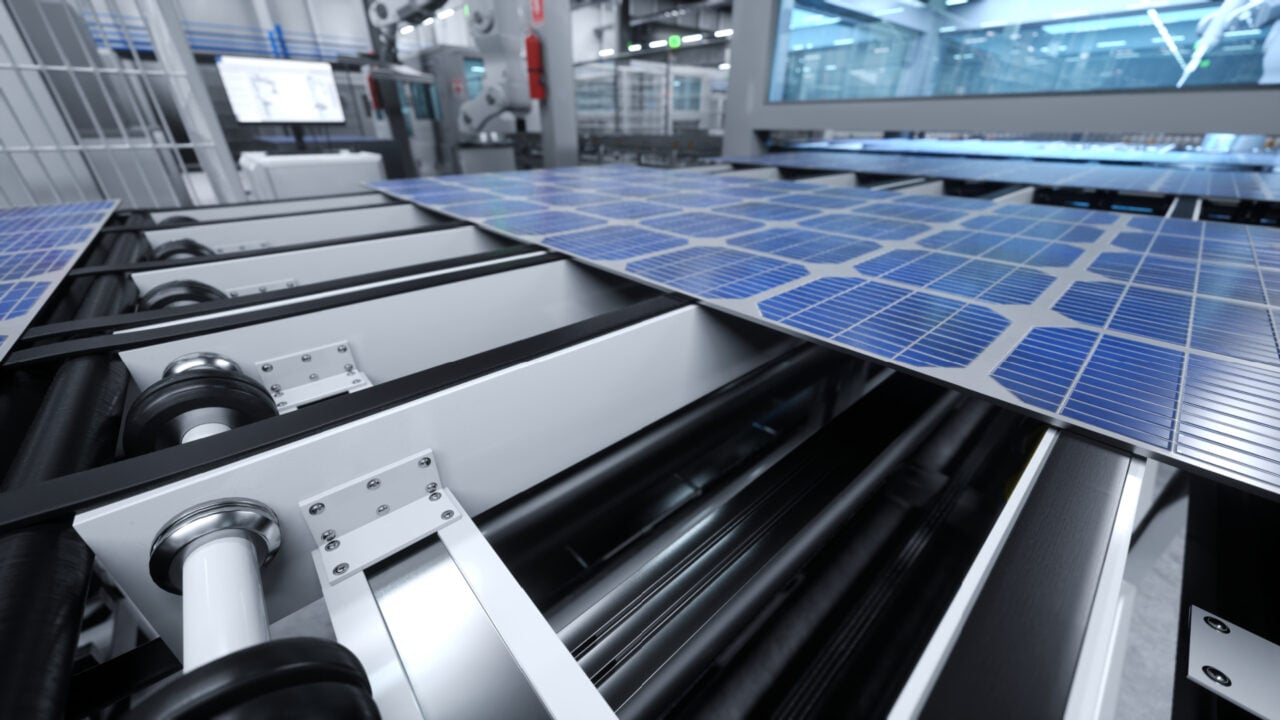
Through its fully owned subsidiary Inox Solar Americas LLC, the company has added 3 GW of functioning TOPCon solar module production capacity to its holdings. Furthermore, a binding commitment exists to secure an extra 3 GW of TOPCon cell production capacity, which is slated to begin operations by the end of 2026. This deal is noted as one of the most significant purchases of U.S. renewable energy assets by an Indian firm.
The acquisition positions Inox Clean among the leading Indian integrated renewable energy manufacturers in the U.S. and marks a calculated entry into a rapidly expanding solar market. Inox Clean stated that the purchase unlocks considerable financial advantages through U.S. domestic manufacturing incentives. Goods produced at the site will be eligible for Section 45X tax credits, which the company says will bolster profitability and lower exposure to tariffs and policy uncertainties by relying on a domestic production base.
The company further explained that the acquisition offers an immediately available and expandable platform in a high-margin, policy-favorable environment. With existing cell supply constraints and the benefits of Section 45X creating advantageous conditions, Inox Clean believes it is well-placed to develop a comprehensive U.S. manufacturing network. The transaction was valued at roughly $750 million for the combined module and cell production assets, and it satisfies all requirements of the company’s valuation strategy.
In the preceding nine months, Inox Clean has carried out nine acquisitions in the independent power producer and solar cell and module manufacturing fields within India and abroad, including the purchases of Vibrant Energy, SkyPower, SunSource Energy, and Wind World India. The company aims to achieve 11 GW of integrated solar manufacturing capacity and 10 GW of operational IPP capacity by the fiscal year 2028, spanning India and key global markets such as the United States and Africa.
Making Data-Driven Decisions to Grow Your Business
A Quick Overview of Market Performance
Understanding the Current State of The Market and its Prospects
Finding New Products to Diversify Your Business
Choosing the Best Countries to Establish Your Sustainable Supply Chain
Choosing the Best Countries to Boost Your Export
The Latest Trends and Insights into The Industry
The Largest Import Supplying Countries
The Largest Destinations for Exports
The Largest Producers on The Market and Their Profiles
The Largest Markets And Their Profiles
This Chapter is Available Only for the Professional Edition
PRO
11.1
United States
11.2
China
11.3
Japan
11.4
Germany
11.5
United Kingdom
11.6
France
11.7
Brazil
11.8
Italy
11.9
Russian Federation
11.10
India
11.11
Canada
11.12
Australia
11.13
Republic of Korea
11.14
Spain
11.15
Mexico
11.16
Indonesia
11.17
Netherlands
11.18
Turkey
11.19
Saudi Arabia
11.20
Switzerland
11.21
Sweden
11.22
Nigeria
11.23
Poland
11.24
Belgium
11.25
Argentina
11.26
Norway
11.27
Austria
11.28
Thailand
11.29
United Arab Emirates
11.30
Colombia
11.31
Denmark
11.32
South Africa
11.33
Malaysia
11.34
Israel
11.35
Singapore
11.36
Egypt
11.37
Philippines
11.38
Finland
11.39
Chile
11.40
Ireland
11.41
Pakistan
11.42
Greece
11.43
Portugal
11.44
Kazakhstan
11.45
Algeria
11.46
Czech Republic
11.47
Qatar
11.48
Peru
11.49
Romania
11.50
Vietnam