Mexican manufacturing: US$46 billion in European investment


Mexican manufacturing: US$46 billion in European investment

According to an analysis by the Mexican Institute for Competitiveness (IMCO), the manufacturing sector attracted US$46.9 billion in investment from the European Union between 2015 and 2024, equivalent to 53% of the total European capital received by the country.

The study highlights that Mexican manufacturing established itself as the primary destination for European investment thanks to logistical integration, proximity to the United States, and the strength of industrial ecosystems located in regions with high export capacity.

The IMCO report notes that German investment played a significant role in this trend, driven by companies such as the Volkswagen Group, BMW, Mercedes-Benz, Bosch, and Continental AG.

In addition, European investment expanded into areas related to infrastructure, energy, services, and construction. The report indicates that construction accounted for US$3.6 billion.

The agency also recommended strengthening partnerships between companies, universities, and technology centers to develop specialized talent and take advantage of the relocation of production chains.

Free Training

Source link

U.S. Manufacturing Expands as Supply Chain Pressures Rise


BIRMINGHAM, Mich. — U.S. manufacturing activity expanded in May at its fastest pace in four years as companies increased inventories ahead of potential supply disruptions and rising costs tied to the war with Iran, according to S&P Global data.

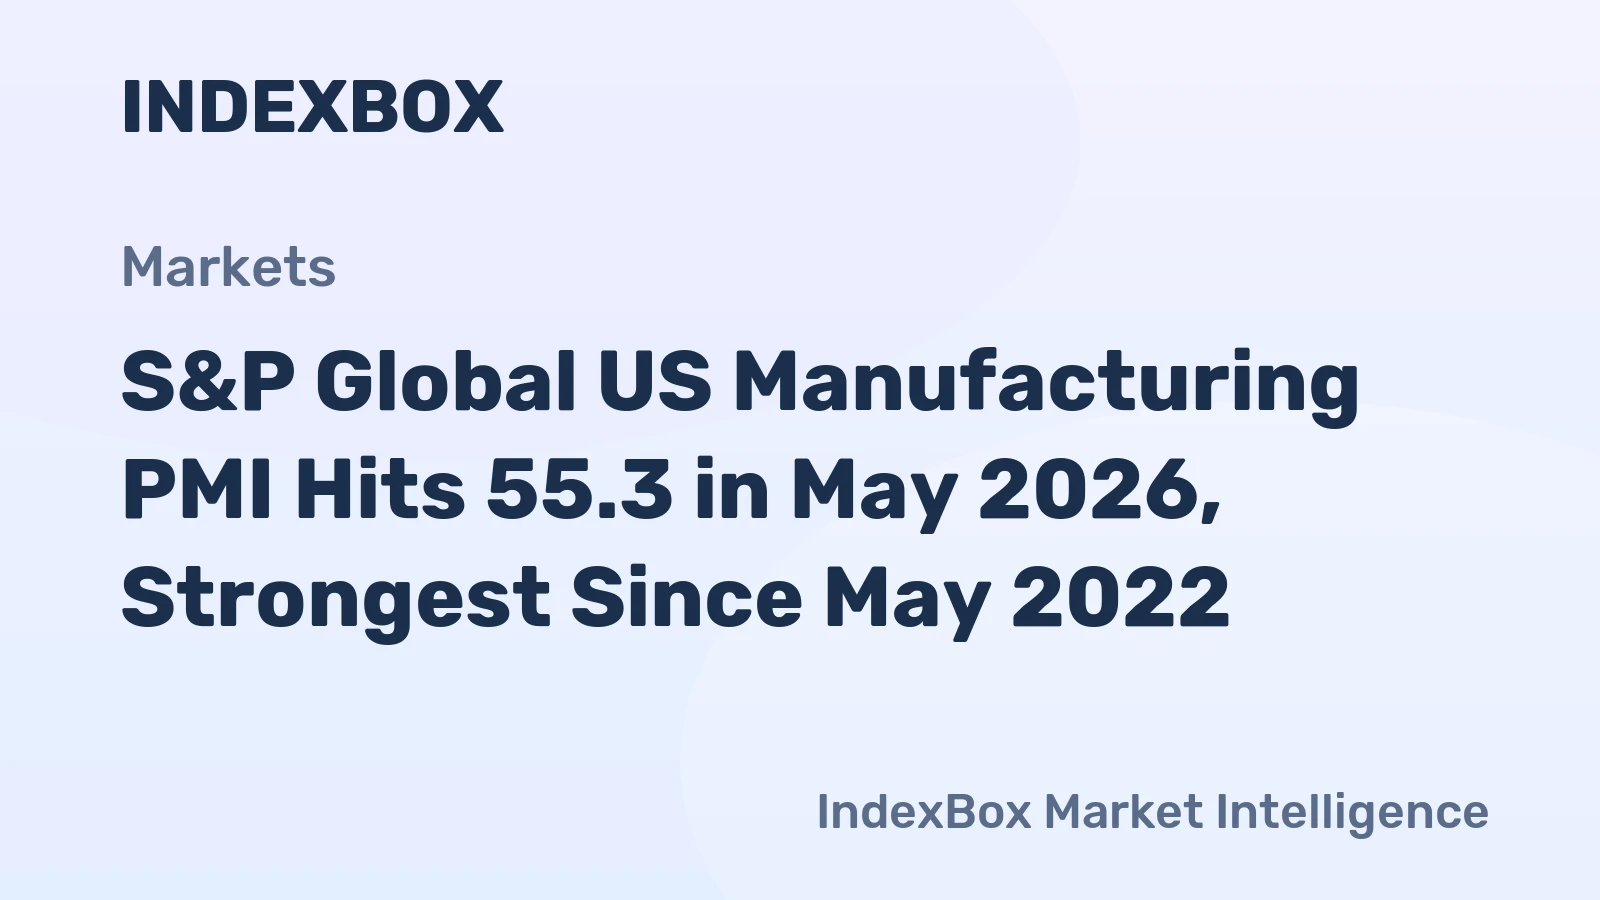
S&P Global’s flash U.S. manufacturing purchasing managers’ index rose to 55.3 in May from 54.5 in April, marking the strongest reading since May 2022. A reading above 50 indicates expansion.

The increase was driven largely by manufacturers building inventories to protect against possible shortages, higher prices and supply chain disruptions. Input inventories climbed to an 11-month high, while supplier delivery times worsened as companies accelerated purchasing activity.

S&P Global said factory input costs reached their highest level since June 2022, while manufacturers also raised output prices.

Manufacturing employment increased modestly.


Looking for quick answers on assembly and manufacturing topics?


Try Ask ASM, our new smart AI search tool.


Ask ASM

Free Training

Source link

U.S. Clean Energy Manufacturing Surges Ahead Despite Policy Hurdles, Reports The American Clean Power Association


Representational image. Credit: Canva

Momentum in the American clean energy manufacturing sector continues to build despite ongoing policy challenges, according to the second annual State of Clean Energy Manufacturing report released by the American Clean Power Association. The report shows that clean energy manufacturing has become a key pillar of the U.S. industrial economy, offering affordable, reliable and quickly deployable domestic solutions to meet the nation’s growing energy needs.

By increasing production within the United States, the industry also boosts national security by reducing dependence on foreign energy supplies and international supply chains.Speaking about the findings, Jason Grumet emphasized that rising energy demand makes it essential to expand clean power systems built in the U.S.

He explained that to sustain the current manufacturing growth, the country needs clear, targeted and consistent international trade policies. This includes reasonable timelines for complying with tariffs and greater regulatory certainty, which would allow clean energy manufacturers to continue supporting economic development and strengthening local communities across the nation.The report highlights several important trends.

It notes that every clean energy manufacturing job generates four additional jobs across the wider economy—one through supply-chain activities and three more through household spending. It also points out that more than 235 new clean energy manufacturing facilities have opened in the United States over the past five years.

Today, more than 300 factories nationwide produce essential components such as wind turbine blades, towers, nacelles, solar modules and batteries. The report further states that domestic manufacturing capacity is now sufficient to fully meet U.S. demand for solar modules, battery modules, wind towers and wind nacelles.

Overall, the findings reinforce that clean energy manufacturing is not only advancing the country’s energy infrastructure but also significantly contributing to economic growth and national resilience, even in the face of policy headwinds.

Free Training

Source link

Press Release: DelBene, Buchanan, and Sewell Introduce Semiconductor Superiority Act to Enhance U.S. Manufacturing and Global Competitiveness


Suzan DelBene introduces the Semiconductor Superiority Act to support U.S. semiconductor manufacturing in space.

Quiver AI Summary

Legislative Proposal Introduced: Representatives Suzan DelBene, Vern Buchanan, and Terri Sewell have introduced the Semiconductor Superiority Act. This bill aims to amend the Section 48D Advanced Manufacturing Investment Credit to explicitly include space-based semiconductor manufacturing, with the goal of enhancing U.S. leadership in the technology sector.

Impact of Space Manufacturing: The legislation seeks to clarify that technologies developed in low-Earth orbit qualify for existing tax incentives aimed at U.S. semiconductor production. Proponents argue that microgravity benefits fabrication processes, enabling advancements critical for emerging technologies like quantum computing and AI, as highlighted by DelBene.

Support from Key Representatives: Buchanan emphasized the importance of keeping U.S. companies competitive in the space economy, while Sewell noted the bill’s potential to strengthen national security and high-paying job creation. The bill is seen as a strategic response to global competition, particularly with China’s advancements in semiconductor technologies.

Disclaimer: This is an AI-generated summary of a press release. The model used to summarize this release may make mistakes. See the full release here.

Check out the Quiver Quantitative API to build on top of data on congressional stock trading, insider transactions, hedge fund moves, and more.

🏛️ Receive Alerts on Congress


Sign Up

Suzan K. DelBene Fundraising

Suzan K. DelBene Fundraising

Suzan K. DelBene recently disclosed $562.3K of fundraising in a Q1 FEC disclosure filed on April 15th, 2026. This was the 190th most from all Q1 reports we have seen this year. 51.2% came from individual donors.

DelBene disclosed $655.5K of spending. This was the 125th most from all Q1 reports we have seen from politicians so far this year.

DelBene disclosed $1.4M of cash on hand at the end of the filing period. This was the 325th most from all Q1 reports we have seen this year.

You can see the disclosure here, or track Suzan K. DelBene’s fundraising on Quiver Quantitative.

Suzan K. DelBene Net Worth

Quiver Quantitative estimates that Suzan K. DelBene is worth $142.9M, as of May 22nd, 2026. This is the 13th highest net worth in Congress, per our live estimates.

DelBene has approximately $18.8M invested in publicly traded assets which Quiver is able to track live.

You can track Suzan K. DelBene’s net worth on Quiver Quantitative’s politician page for DelBene.

Suzan K. DelBene Bill Proposals

Here are some bills which have recently been proposed by Suzan K. DelBene:

  • H.R.8261: Chronic Care Management Improvement Act of 2026
  • H.R.7868: Expanding Support for Living Donors Act of 2026
  • H.R.6787: Clean Competition Act
  • H.R.5940: Seniors Deserve SMARTER Care Act of 2025
  • H.R.4649: Smart Cities and Communities Act of 2025
  • H.R.2421: Protecting Taxpayer Resources Act

You can track bills proposed by Suzan K. DelBene on Quiver Quantitative’s politician page for DelBene.

2026 Washington’s 1st Congressional District Election

There has been approximately $4,533,458 of spending in Washington’s 1st congressional district elections over the last two years, per our estimates.

The rating for this race is currently “Solid D”.

You can track this election on our matchup page for the 2026 Washington’s 1st congressional district election.

Free Training

Source link

$100M Letter Of Intent Boosts PsiQuantum’s US Manufacturing


PsiQuantum has secured a $100 million Letter of Intent with the U. S. Department of Commerce, proposed under the CHIPS and Science Act, to bolster domestic quantum computing and semiconductor manufacturing. The funding will specifically accelerate the domestic production of key components like Barium Titanate (BTO), a material crucial for higher-performance optical switches within PsiQuantum’s quantum systems. Development will center at PsiFactory in Milpitas, California, where the company’s chip-to-fiber coupling technology is currently being refined. “Strong technology supply chains are essential for American security and prosperity,” said Victor Peng, Interim Chief Executive Officer of PsiQuantum. This partnership aims to advance quantum capabilities and strengthen the broader American semiconductor industry through scalable silicon photonics.

CHIPS Act Incentives Fuel Quantum Computing Advancement

The focus on BTO demonstrates a specific approach to strengthening the quantum supply chain, addressing a bottleneck in the development of more powerful quantum computers. PsiQuantum’s existing commitment to domestic sourcing is substantial, having already invested approximately $200 million with American suppliers across 38 states, a foundation the Department of Commerce incentives aim to build upon. This partnership extends beyond financial support, with the Department of Commerce recognizing implications for national defense, materials science, and financial modeling. Bill Frauenhofer, Executive Director of Semiconductor Investment and Innovation, stated that quantum computing has significant implications for national defense, advanced materials and biopharmaceutical discovery, financial modeling and energy systems. Dr. Pete Shadbolt, Co-Founder and Chief Scientific Officer of PsiQuantum, emphasized the relationship between the semiconductor industry and quantum computing, noting that the semiconductor industry helped make PsiQuantum’s path to fault-tolerant quantum computing possible, and PsiQuantum’s scalable breakthroughs in silicon photonics will create new possibilities for the future of computing.

PsiQuantum’s Silicon Photonics for Scalable Quantum Systems

PsiQuantum is pursuing a silicon photonics approach to quantum computing, differing from more common superconducting or trapped ion methodologies currently in early-stage development. This strategy centers on leveraging existing semiconductor manufacturing processes to accelerate scalability, a critical hurdle in realizing practical quantum computers; the company’s innovations focus on qubit creation and the infrastructure needed to connect and control them. A recently announced Letter of Intent with the U. S. This investment isn’t limited to materials science; funding will also support improvements in single-photon detectors, essential for reading out qubit states, and reducing the cost and complexity of cryogenic systems required to operate the quantum processor.

GlobalFoundries is excited to partner with PsiQuantum to accelerate photonic quantum computing.

Tim Breen, Chief Executive Officer of GlobalFoundries

Barium Titanate Manufacturing & Detector Technology Scaling

PsiQuantum is intensifying its focus on domestic materials science, specifically the manufacturing of barium titanate (BTO), as a crucial component in scaling quantum computing capabilities. The company’s commitment extends beyond theoretical advancements; it is actively building a supply chain anchored within the United States, with approximately $200 million already invested with American suppliers and vendors across 38 states. The focus on BTO isn’t arbitrary, as this material is integral to creating higher-performance optical switches, improving the overall functionality of quantum systems. PsiQuantum currently utilizes a Molecular Beam Epitaxy tool in Santa Clara, California, to develop 300mm wafers of BTO, and the Department of Commerce funding will directly support scaling this domestic manufacturing capacity. Beyond BTO, the company is also concentrating on high-temperature single-photon detectors, aiming to improve cost, complexity, energy requirements, and integration with support from the Commerce Department.

This location will serve as a key hub for accelerating these advancements. The company’s work with the Air Force Research Laboratory (AFRL) in Rome, New York, further exemplifies this commitment, integrating BTO electro-switch material into AFRL-designed optical circuits, demonstrating a collaborative effort to advance quantum technology for national defense applications.

The semiconductor industry helped make PsiQuantum’s path to fault-tolerant quantum computing possible, and now PsiQuantum’s scalable breakthroughs in silicon photonics will in turn create new possibilities for the future of computing.

Dr. Pete Shadbolt, Co-Founder and Chief Scientific Officer of PsiQuantum

Stay current. See today’s quantum computing news on Quantum Zeitgeist for the latest breakthroughs in qubits, hardware, algorithms, and industry deals.

Free Training

Source link

US Manufacturing PMI Surges to 55.3 in May 2026, Beating Expectations | Trading Economics – News and Statistics


May 21, 2026

The S&P Global US Manufacturing PMI climbed to 55.3 in May 2026, according to preliminary data from the source, Trading Economics. This reading surpassed the 54.5 recorded in April and exceeded market expectations of 53.8, representing the strongest manufacturing expansion since May 2022. Output grew at the fastest pace in over four years, while job creation reached its highest level since June 2025.

New order growth decelerated but remained the second-strongest in four years, partly supported by clients engaging in precautionary stockpiling due to the Middle East conflict. Input inventories also contributed to the PMI increase, rising at the sharpest rate in 11 months, though this partly reflected safety stock building amid concerns over prices and supply. Supplier delivery times lengthened the most since August 2022.

  1. 1. INTRODUCTION

    Making Data-Driven Decisions to Grow Your Business

    1. REPORT DESCRIPTION
    2. RESEARCH METHODOLOGY AND THE AI PLATFORM
    3. DATA-DRIVEN DECISIONS FOR YOUR BUSINESS
    4. GLOSSARY AND SPECIFIC TERMS
  2. 2. EXECUTIVE SUMMARY

    A Quick Overview of Market Performance

    1. KEY FINDINGS
    2. MARKET TRENDS This Chapter is Available Only for the Professional EditionPRO
  3. 3. MARKET OVERVIEW

    Understanding the Current State of The Market and its Prospects

    1. MARKET SIZE: HISTORICAL DATA (2012–2025) AND FORECAST (2026–2035)
    2. CONSUMPTION BY COUNTRY: HISTORICAL DATA (2012–2025) AND FORECAST (2026–2035)
    3. MARKET FORECAST TO 2035
  4. 4. MOST PROMISING PRODUCTS FOR DIVERSIFICATION

    Finding New Products to Diversify Your Business

    1. TOP PRODUCTS TO DIVERSIFY YOUR BUSINESS
    2. BEST-SELLING PRODUCTS
    3. MOST CONSUMED PRODUCTS
    4. MOST TRADED PRODUCTS
    5. MOST PROFITABLE PRODUCTS FOR EXPORT
  5. 5. MOST PROMISING SUPPLYING COUNTRIES

    Choosing the Best Countries to Establish Your Sustainable Supply Chain

    1. TOP COUNTRIES TO SOURCE YOUR PRODUCT
    2. TOP PRODUCING COUNTRIES
    3. TOP EXPORTING COUNTRIES
    4. LOW-COST EXPORTING COUNTRIES
  6. 6. MOST PROMISING OVERSEAS MARKETS

    Choosing the Best Countries to Boost Your Export

    1. TOP OVERSEAS MARKETS FOR EXPORTING YOUR PRODUCT
    2. TOP CONSUMING MARKETS
    3. UNSATURATED MARKETS
    4. TOP IMPORTING MARKETS
    5. MOST PROFITABLE MARKETS
  7. 7. PRODUCTION

    The Latest Trends and Insights into The Industry

    1. PRODUCTION VOLUME AND VALUE: HISTORICAL DATA (2012–2025) AND FORECAST (2026–2035)
    2. PRODUCTION BY COUNTRY: HISTORICAL DATA (2012–2025) AND FORECAST (2026–2035)
  8. 8. IMPORTS

    The Largest Import Supplying Countries

    1. IMPORTS: HISTORICAL DATA (2012–2025) AND FORECAST (2026–2035)
    2. IMPORTS BY COUNTRY: HISTORICAL DATA (2012–2025) AND FORECAST (2026–2035)
    3. IMPORT PRICES BY COUNTRY: HISTORICAL DATA (2012–2025) AND FORECAST (2026–2035)
  9. 9. EXPORTS

    The Largest Destinations for Exports

    1. EXPORTS: HISTORICAL DATA (2012–2025) AND FORECAST (2026–2035)
    2. EXPORTS BY COUNTRY: HISTORICAL DATA (2012–2025) AND FORECAST (2026–2035)
    3. EXPORT PRICES BY COUNTRY: HISTORICAL DATA (2012–2025) AND FORECAST (2026–2035)
  10. 10. PROFILES OF MAJOR PRODUCERS

    The Largest Producers on The Market and Their Profiles

  11. 11. COUNTRY PROFILES

    The Largest Markets And Their Profiles

    This Chapter is Available Only for the Professional Edition
    PRO

    1. 11.1

      United States

      • Market Size
      • Production
      • Imports
      • Exports
    2. 11.2

      China

      • Market Size
      • Production
      • Imports
      • Exports
    3. 11.3

      Japan

      • Market Size
      • Production
      • Imports
      • Exports
    4. 11.4

      Germany

      • Market Size
      • Production
      • Imports
      • Exports
    5. 11.5

      United Kingdom

      • Market Size
      • Production
      • Imports
      • Exports
    6. 11.6

      France

      • Market Size
      • Production
      • Imports
      • Exports
    7. 11.7

      Brazil

      • Market Size
      • Production
      • Imports
      • Exports
    8. 11.8

      Italy

      • Market Size
      • Production
      • Imports
      • Exports
    9. 11.9

      Russian Federation

      • Market Size
      • Production
      • Imports
      • Exports
    10. 11.10

      India

      • Market Size
      • Production
      • Imports
      • Exports
    11. 11.11

      Canada

      • Market Size
      • Production
      • Imports
      • Exports
    12. 11.12

      Australia

      • Market Size
      • Production
      • Imports
      • Exports
    13. 11.13

      Republic of Korea

      • Market Size
      • Production
      • Imports
      • Exports
    14. 11.14

      Spain

      • Market Size
      • Production
      • Imports
      • Exports
    15. 11.15

      Mexico

      • Market Size
      • Production
      • Imports
      • Exports
    16. 11.16

      Indonesia

      • Market Size
      • Production
      • Imports
      • Exports
    17. 11.17

      Netherlands

      • Market Size
      • Production
      • Imports
      • Exports
    18. 11.18

      Turkey

      • Market Size
      • Production
      • Imports
      • Exports
    19. 11.19

      Saudi Arabia

      • Market Size
      • Production
      • Imports
      • Exports
    20. 11.20

      Switzerland

      • Market Size
      • Production
      • Imports
      • Exports
    21. 11.21

      Sweden

      • Market Size
      • Production
      • Imports
      • Exports
    22. 11.22

      Nigeria

      • Market Size
      • Production
      • Imports
      • Exports
    23. 11.23

      Poland

      • Market Size
      • Production
      • Imports
      • Exports
    24. 11.24

      Belgium

      • Market Size
      • Production
      • Imports
      • Exports
    25. 11.25

      Argentina

      • Market Size
      • Production
      • Imports
      • Exports
    26. 11.26

      Norway

      • Market Size
      • Production
      • Imports
      • Exports
    27. 11.27

      Austria

      • Market Size
      • Production
      • Imports
      • Exports
    28. 11.28

      Thailand

      • Market Size
      • Production
      • Imports
      • Exports
    29. 11.29

      United Arab Emirates

      • Market Size
      • Production
      • Imports
      • Exports
    30. 11.30

      Colombia

      • Market Size
      • Production
      • Imports
      • Exports
    31. 11.31

      Denmark

      • Market Size
      • Production
      • Imports
      • Exports
    32. 11.32

      South Africa

      • Market Size
      • Production
      • Imports
      • Exports
    33. 11.33

      Malaysia

      • Market Size
      • Production
      • Imports
      • Exports
    34. 11.34

      Israel

      • Market Size
      • Production
      • Imports
      • Exports
    35. 11.35

      Singapore

      • Market Size
      • Production
      • Imports
      • Exports
    36. 11.36

      Egypt

      • Market Size
      • Production
      • Imports
      • Exports
    37. 11.37

      Philippines

      • Market Size
      • Production
      • Imports
      • Exports
    38. 11.38

      Finland

      • Market Size
      • Production
      • Imports
      • Exports
    39. 11.39

      Chile

      • Market Size
      • Production
      • Imports
      • Exports
    40. 11.40

      Ireland

      • Market Size
      • Production
      • Imports
      • Exports
    41. 11.41

      Pakistan

      • Market Size
      • Production
      • Imports
      • Exports
    42. 11.42

      Greece

      • Market Size
      • Production
      • Imports
      • Exports
    43. 11.43

      Portugal

      • Market Size
      • Production
      • Imports
      • Exports
    44. 11.44

      Kazakhstan

      • Market Size
      • Production
      • Imports
      • Exports
    45. 11.45

      Algeria

      • Market Size
      • Production
      • Imports
      • Exports
    46. 11.46

      Czech Republic

      • Market Size
      • Production
      • Imports
      • Exports
    47. 11.47

      Qatar

      • Market Size
      • Production
      • Imports
      • Exports
    48. 11.48

      Peru

      • Market Size
      • Production
      • Imports
      • Exports
    49. 11.49

      Romania

      • Market Size
      • Production
      • Imports
      • Exports
    50. 11.50

      Vietnam

      • Market Size
      • Production
      • Imports
      • Exports
  12. LIST OF TABLES

    1. Key Findings In 2025
    2. Market Volume, In Physical Terms: Historical Data (2012–2025) and Forecast (2026–2035)
    3. Market Value: Historical Data (2012–2025) and Forecast (2026–2035)
    4. Per Capita Consumption, by Country, 2022–2025
    5. Production, In Physical Terms, By Country: Historical Data (2012–2025) and Forecast (2026–2035)
    6. Imports, In Physical Terms, By Country: Historical Data (2012–2025) and Forecast (2026–2035)
    7. Imports, In Value Terms, By Country: Historical Data (2012–2025) and Forecast (2026–2035)
    8. Import Prices, By Country: Historical Data (2012–2025) and Forecast (2026–2035)
    9. Exports, In Physical Terms, By Country: Historical Data (2012–2025) and Forecast (2026–2035)
    10. Exports, In Value Terms, By Country: Historical Data (2012–2025) and Forecast (2026–2035)
    11. Export Prices, By Country: Historical Data (2012–2025) and Forecast (2026–2035)
  13. LIST OF FIGURES

    1. Market Volume, In Physical Terms: Historical Data (2012–2025) and Forecast (2026–2035)
    2. Market Value: Historical Data (2012–2025) and Forecast (2026–2035)
    3. Consumption, by Country, 2025
    4. Market Volume Forecast to 2035
    5. Market Value Forecast to 2035
    6. Market Size and Growth, By Product
    7. Average Per Capita Consumption, By Product
    8. Exports and Growth, By Product
    9. Export Prices and Growth, By Product
    10. Production Volume and Growth
    11. Exports and Growth
    12. Export Prices and Growth
    13. Market Size and Growth
    14. Per Capita Consumption
    15. Imports and Growth
    16. Import Prices
    17. Production, In Physical Terms: Historical Data (2012–2025) and Forecast (2026–2035)
    18. Production, In Value Terms: Historical Data (2012–2025) and Forecast (2026–2035)
    19. Production, by Country, 2025
    20. Production, In Physical Terms, by Country: Historical Data (2012–2025) and Forecast (2026–2035)
    21. Imports, In Physical Terms: Historical Data (2012–2025) and Forecast (2026–2035)
    22. Imports, In Value Terms: Historical Data (2012–2025) and Forecast (2026–2035)
    23. Imports, In Physical Terms, By Country, 2025
    24. Imports, In Physical Terms, By Country: Historical Data (2012–2025) and Forecast (2026–2035)
    25. Imports, In Value Terms, By Country: Historical Data (2012–2025) and Forecast (2026–2035)
    26. Import Prices, By Country: Historical Data (2012–2025) and Forecast (2026–2035)
    27. Exports, In Physical Terms: Historical Data (2012–2025) and Forecast (2026–2035)
    28. Exports, In Value Terms: Historical Data (2012–2025) and Forecast (2026–2035)
    29. Exports, In Physical Terms, By Country, 2025
    30. Exports, In Physical Terms, By Country: Historical Data (2012–2025) and Forecast (2026–2035)
    31. Exports, In Value Terms, By Country: Historical Data (2012–2025) and Forecast (2026–2035)
    32. Export Prices, By Country: Historical Data (2012–2025) and Forecast (2026–2035)

Free Training

Source link

U.S. Manufacturing Activity Hit A Four-Year High in May, But There’s a Caveat


U.S. manufacturing activity rose to its highest level in four years in May amid rising costs, supply disruptions and uncertainty tied to the war with Iran, according to new data.

The S&P Global flash U.S. manufacturing purchasing managers’ index climbed to 55.3 in May from 54.5 in April, marking the strongest reading since May 2022. A reading above 50 indicates expansion.

The gain, however, was driven largely by manufacturers building inventories to protect against potential shortages and higher prices. S&P Global’s survey showed input inventories rose to an 11-month high, while supplier delivery times worsened, a pattern consistent with companies buying ahead of possible supply chain problems.

However, S&P Global said cost pressures intensified, with factory input costs reaching their highest level since June 2022. Companies also raised output prices, suggesting that some of those higher costs may eventually reach consumers.

The broader economy also looked softer than the headline manufacturing figure. S&P Global’s flash composite PMI, which tracks manufacturing and services, held at 51.7 in May. The services PMI slipped to 50.9 from 51.0, barely above contraction territory. Manufacturing employment rose modestly, but overall private-sector employment fell to its lowest level in 21 months, largely because of weaker services hiring.

Chris Williamson, chief business economist at S&P Global Market Intelligence, told Reuters that the reading indicated “that the economy will struggle to manage annualized GDP growth of much more ​than 1% in the second quarter.” He also cautioned that inventory accumulation tied to supply concerns is not a durable engine for expansion.

“On average, over the past three months order book growth has slowed to its weakest for two ⁠years, ​and a boost from precautionary stock building due to concerns over ​further price hikes and supply delays will not last forever,” said Williamson.

Manufacturing represents a smaller share of the U.S. economy than services, but remains closely watched because it is sensitive to global demand, shipping costs, commodity prices, and business confidence. The sector accounts for about 9.4% of the economy, according to the National Association of Manufacturers, so its strength alone may not be enough to offset weakness in services.

Free Training

Source link

Acquisition Of Solestial Strengthens U.S.-Based Space Solar Manufacturing Capabilities


York Space Systems announced it has entered into a definitive agreement to acquire Solestial, a provider of next-generation space solar technology, in a move designed to strengthen York’s supply chain and secure critical U.S.-based solar manufacturing capabilities for space applications.

Based in Tempe, Arizona, Solestial develops ultrathin, radiation-hardened silicon solar cells and modules specifically engineered for the space environment. The company is known for its self-healing silicon technology, which has already been proven on orbit and is designed to enable scalable, high-volume manufacturing.

York said the acquisition will help reduce reliance on Chinese-controlled materials and manufacturing while strengthening domestic production capabilities for mission-critical space systems. Following the transaction’s close, Solestial will operate as a wholly owned subsidiary of York while continuing to support customers across the commercial, civil, and national security markets.

The acquisition comes as demand for space-based power systems continues to increase across satellite constellations, national defense missions, and future lunar and deep-space initiatives. York noted that traditional III-V solar solutions remain expensive and constrained by long lead times, while terrestrial silicon alternatives are not optimized for radiation-heavy space environments.

York executives said integrating Solestial’s technology into its platform strategy will improve manufacturing reliability, scalability, and cost efficiency while enhancing control over critical subsystems.

Solestial has already established a growing U.S. manufacturing footprint, with approximately 95% of its supply chain currently based in the United States and plans to transition to fully domestic production. The company recently expanded its manufacturing capacity through the acquisition of advanced high-volume solar manufacturing equipment capable of supporting wafer-to-module production within the U.S.

The transaction is expected to close during the second quarter, subject to customary regulatory approvals and closing conditions.

York Space Systems is a U.S.-based defense and commercial space prime contractor that provides hardware and software solutions across the space mission lifecycle for government, national security, and commercial customers.

Solestial focuses on delivering scalable and affordable space solar technology through flexible, low-mass solar power modules engineered for long-duration use in space environments.

KEY QUOTES:

“York has consistently invested in U.S.-based manufacturing as a core part of how we deliver for our customers. This acquisition builds on that approach, strengthening our supply chain by investing in a proven U.S. company, supporting the domestic industrial base, and reducing reliance on foreign sources for critical materials and manufacturing.”

Dirk Wallinger, CEO, York Space Systems

“Solestial has proven a scalable, space-optimized solar technology that is designed to perform in ways legacy and terrestrial solutions cannot. That will give us the ability to build more capable platforms with better performance, lower cost, and greater design flexibility.”

Mike Lajczok, CTO, York Space Systems

“Solestial was founded to solve the space power bottleneck. Our customers need a solution that can scale, perform in space, and be manufactured reliably. Partnering with York allows us to accelerate all three; expanding production, deepening technical integration, and delivering a resilient, American-made capability to a broader set of missions.”

Margo de Naray, CEO, Solestial


Free Training

Source link

CEP USA Opens First U.S. Manufacturing Facility In North Little Rock Arkansas


CEP USA has officially opened its first United States manufacturing facility in North Little Rock, bringing new investment and jobs to Central Arkansas. The company is investing nearly $1 million into the new operation and expects to create approximately 27 jobs over the next 5 years.

Company leaders joined state and local officials Tuesday for the grand opening ceremony at the new facility located at 9401 Diamond Drive in North Little Rock. The project was developed through a partnership involving the Arkansas Economic Development Commission and the Little Rock Regional Chamber.

CEP is an Italian company specializing in the design, construction, and turnkey delivery of prefabricated electrical substations with operations in more than 80 countries. Company officials say Arkansas was selected because of its strategic location, business environment, and partnerships with SMA Solar and Mountain Ridge Energy Service of Conway.

The facility will manufacture medium-voltage power station platforms and related electrical equipment for utility-scale energy projects across the United States.

Governor Sarah Huckabee Sanders praised the company’s investment, saying Arkansas provides a strong workforce and business-friendly climate for international manufacturers. North Little Rock Mayor Terry Hartwick also welcomed CEP USA, saying the company’s arrival strengthens the city’s growing reputation for innovation and advanced manufacturing.


News Staff

Free Training

Source link

U.S. Charges 4 Of The World’s Largest Shipping Container Manufacturers Over Multi-Billion-Dollar Trade Conspiracy


shippingImage for representation purposes only

The United States has charged seven Chinese executives and four of the world’s biggest shipping container manufacturers with allegedly fixing prices and restricting the global supply of shipping containers during the COVID-19 pandemic.

The U.S. Department of Justice (DOJ) said the companies controlled about 95% of the world’s standard dry shipping container production and worked together between November 2019 and January 2024 to limit output and raise prices.

Prosecutors said the alleged conspiracy increased the cost of shipping containers during the global supply chain crisis, forcing businesses and consumers to pay more for goods shipped worldwide.

The companies named in the indictment are Hong Kong-listed Singamas Container Holdings Ltd., Chinese container manufacturing giant China International Marine Containers (Group) Co., Ltd. (CIMC), Shanghai Universal Logistics Equipment Co., Ltd., also known as Dong Fang International Containers, and CXIC Group Containers Co. Ltd..

The DOJ said executives from the companies met in Shenzhen in November 2019 and agreed to reduce production in order to increase container prices.

According to prosecutors, the companies limited production shifts and factory operating hours, agreed not to build new factories, and created a penalty system for companies that broke the agreement.

Investigators also alleged the companies installed 87 surveillance cameras across 49 production lines to make sure manufacturers followed the agreed production limits.

By September 2020, prosecutors said the alleged cartel expanded the arrangement to limit the number of containers supplied to specific customers, including major U.S.-based shipping lines, logistics companies and container leasing firms.

The DOJ said the conspiracy later evolved into production caps that remained in place until at least late 2023.

Prosecutors cited internal presentations allegedly showing “allowable quota” limits assigned to participating manufacturers and factories.

One executive, Vick Nam Hing Ma, a marketing director at Singamas, was arrested in France in April 2026 and is awaiting extradition to the United States. Six other executives remain at large.

Other executives charged include Siong Seng Teo, Boliang Mai, Tianhua Huang, Yongbo Wan, Qianmin Li and Yuqiang Zhang.

U.S. officials said the alleged cartel operated during one of the worst global shipping disruptions in recent history, when container shortages and port congestion disrupted trade routes and increased freight costs worldwide.

According to the indictment, CIMC’s container manufacturing profits rose from about $19.8 million in 2019 to around $1.75 billion in 2021.

Singamas also moved from a loss of about $110 million in 2019 to profits of around $186.8 million in 2021.

Associate Attorney General Stanley Woodward accused the companies of manipulating markets during the pandemic, while Acting Assistant Attorney General Omeed A. Assefi said the companies “held hostage the world’s supply of ocean shipping containers” during the global supply chain crisis.

The companies and executives were charged under the Sherman Antitrust Act, which carries a maximum sentence of 10 years in prison for individuals and fines of up to $100 million for companies.

Reference: US Department of Justice

Disclaimer :
The information on this website is for general purposes only. While efforts are made to ensure accuracy, we make no warranties of any kind regarding completeness, reliability, or suitability. Any reliance you place on such information is at your own risk. We are not liable for any loss or damage arising from the use of this website.

Disclaimer :
The information on this website is for general purposes only. While efforts are made to ensure accuracy, we make no warranties of any kind regarding completeness, reliability, or suitability. Any reliance you place on such information is at your own risk. We are not liable for any loss or damage arising from the use of this website.

Free Training

Source link