
Mondelez Integrates AI and Automation in Supply Chain and Manufacturing Overhaul – News and Statistics


May 19, 2026

Mondelez International has announced plans to integrate automation and artificial intelligence at up to five distribution centers that support its direct-store-delivery network, while also overhauling a portion of its U.S. manufacturing footprint, according to a company earnings call.

Speaking on an April 28 earnings call, EVP, COO and CFO Luca Zaramella explained that the automated fulfillment centers are expected to help the snack and confectionery company reach points of sale more quickly, reduce inventory, and lower costs across the 55 branches served by those centers.

In manufacturing, Zaramella stated that approximately 60% of the U.S. network has already been modernized. However, some plants within the remaining 40% operate with high waste and at a productivity level that is below expectations. He noted that certain facilities will need to focus on simpler production lines instead of complex, state-of-the-art lines, allowing the company to play to each plant’s strengths.

Mondelez also aims to cut expenses by bringing in-house the manufacturing of product lines currently handled by co-manufacturers, which Zaramella said will save a significant amount of money. Additionally, the company plans to bring all packaging for mixed packs of cookies and crackers in-house, a move Zaramella described as important for competing in the club channel, as it removes rigidity and inefficiency from the current system.

The supply chain update on the earnings call followed an earlier announcement by executives that Mondelez had launched a multiyear supply chain improvement program for its U.S. biscuits operations. Chairman and CEO Dirk Van de Put stated at the Consumer Analyst Group of New York Conference in February that the program is expected to boost capacity for biscuit, cake, and pastry production, modernize packaging capabilities, and increase network flexibility. Van de Put anticipated that the company would begin realizing the benefits of these enhancements at the start of 2027.

Mondelez is currently halfway through a $1.2 billion, multi-year overhaul of its supply chain and ERP system. The project was launched in 2024 and is planned to roll out in phases until completion in 2028.

  1. 1. INTRODUCTION

    Making Data-Driven Decisions to Grow Your Business

    1. REPORT DESCRIPTION
    2. RESEARCH METHODOLOGY AND THE AI PLATFORM
    3. DATA-DRIVEN DECISIONS FOR YOUR BUSINESS
    4. GLOSSARY AND SPECIFIC TERMS
  2. 2. EXECUTIVE SUMMARY

    A Quick Overview of Market Performance

    1. KEY FINDINGS
    2. MARKET TRENDS This Chapter is Available Only for the Professional EditionPRO
  3. 3. MARKET OVERVIEW

    Understanding the Current State of The Market and its Prospects

    1. MARKET SIZE: HISTORICAL DATA (2012–2025) AND FORECAST (2026–2035)
    2. CONSUMPTION BY COUNTRY: HISTORICAL DATA (2012–2025) AND FORECAST (2026–2035)
    3. MARKET FORECAST TO 2035
  4. 4. MOST PROMISING PRODUCTS FOR DIVERSIFICATION

    Finding New Products to Diversify Your Business

    1. TOP PRODUCTS TO DIVERSIFY YOUR BUSINESS
    2. BEST-SELLING PRODUCTS
    3. MOST CONSUMED PRODUCTS
    4. MOST TRADED PRODUCTS
    5. MOST PROFITABLE PRODUCTS FOR EXPORT
  5. 5. MOST PROMISING SUPPLYING COUNTRIES

    Choosing the Best Countries to Establish Your Sustainable Supply Chain

    1. TOP COUNTRIES TO SOURCE YOUR PRODUCT
    2. TOP PRODUCING COUNTRIES
    3. TOP EXPORTING COUNTRIES
    4. LOW-COST EXPORTING COUNTRIES
  6. 6. MOST PROMISING OVERSEAS MARKETS

    Choosing the Best Countries to Boost Your Export

    1. TOP OVERSEAS MARKETS FOR EXPORTING YOUR PRODUCT
    2. TOP CONSUMING MARKETS
    3. UNSATURATED MARKETS
    4. TOP IMPORTING MARKETS
    5. MOST PROFITABLE MARKETS
  7. 7. PRODUCTION

    The Latest Trends and Insights into The Industry

    1. PRODUCTION VOLUME AND VALUE: HISTORICAL DATA (2012–2025) AND FORECAST (2026–2035)
    2. PRODUCTION BY COUNTRY: HISTORICAL DATA (2012–2025) AND FORECAST (2026–2035)
  8. 8. IMPORTS

    The Largest Import Supplying Countries

    1. IMPORTS: HISTORICAL DATA (2012–2025) AND FORECAST (2026–2035)
    2. IMPORTS BY COUNTRY: HISTORICAL DATA (2012–2025) AND FORECAST (2026–2035)
    3. IMPORT PRICES BY COUNTRY: HISTORICAL DATA (2012–2025) AND FORECAST (2026–2035)
  9. 9. EXPORTS

    The Largest Destinations for Exports

    1. EXPORTS: HISTORICAL DATA (2012–2025) AND FORECAST (2026–2035)
    2. EXPORTS BY COUNTRY: HISTORICAL DATA (2012–2025) AND FORECAST (2026–2035)
    3. EXPORT PRICES BY COUNTRY: HISTORICAL DATA (2012–2025) AND FORECAST (2026–2035)
  10. 10. PROFILES OF MAJOR PRODUCERS

    The Largest Producers on The Market and Their Profiles

  11. 11. COUNTRY PROFILES

    The Largest Markets And Their Profiles

    This Chapter is Available Only for the Professional Edition
    PRO

    1. 11.1

      United States

      • Market Size
      • Production
      • Imports
      • Exports
    2. 11.2

      China

      • Market Size
      • Production
      • Imports
      • Exports
    3. 11.3

      Japan

      • Market Size
      • Production
      • Imports
      • Exports
    4. 11.4

      Germany

      • Market Size
      • Production
      • Imports
      • Exports
    5. 11.5

      United Kingdom

      • Market Size
      • Production
      • Imports
      • Exports
    6. 11.6

      France

      • Market Size
      • Production
      • Imports
      • Exports
    7. 11.7

      Brazil

      • Market Size
      • Production
      • Imports
      • Exports
    8. 11.8

      Italy

      • Market Size
      • Production
      • Imports
      • Exports
    9. 11.9

      Russian Federation

      • Market Size
      • Production
      • Imports
      • Exports
    10. 11.10

      India

      • Market Size
      • Production
      • Imports
      • Exports
    11. 11.11

      Canada

      • Market Size
      • Production
      • Imports
      • Exports
    12. 11.12

      Australia

      • Market Size
      • Production
      • Imports
      • Exports
    13. 11.13

      Republic of Korea

      • Market Size
      • Production
      • Imports
      • Exports
    14. 11.14

      Spain

      • Market Size
      • Production
      • Imports
      • Exports
    15. 11.15

      Mexico

      • Market Size
      • Production
      • Imports
      • Exports
    16. 11.16

      Indonesia

      • Market Size
      • Production
      • Imports
      • Exports
    17. 11.17

      Netherlands

      • Market Size
      • Production
      • Imports
      • Exports
    18. 11.18

      Turkey

      • Market Size
      • Production
      • Imports
      • Exports
    19. 11.19

      Saudi Arabia

      • Market Size
      • Production
      • Imports
      • Exports
    20. 11.20

      Switzerland

      • Market Size
      • Production
      • Imports
      • Exports
    21. 11.21

      Sweden

      • Market Size
      • Production
      • Imports
      • Exports
    22. 11.22

      Nigeria

      • Market Size
      • Production
      • Imports
      • Exports
    23. 11.23

      Poland

      • Market Size
      • Production
      • Imports
      • Exports
    24. 11.24

      Belgium

      • Market Size
      • Production
      • Imports
      • Exports
    25. 11.25

      Argentina

      • Market Size
      • Production
      • Imports
      • Exports
    26. 11.26

      Norway

      • Market Size
      • Production
      • Imports
      • Exports
    27. 11.27

      Austria

      • Market Size
      • Production
      • Imports
      • Exports
    28. 11.28

      Thailand

      • Market Size
      • Production
      • Imports
      • Exports
    29. 11.29

      United Arab Emirates

      • Market Size
      • Production
      • Imports
      • Exports
    30. 11.30

      Colombia

      • Market Size
      • Production
      • Imports
      • Exports
    31. 11.31

      Denmark

      • Market Size
      • Production
      • Imports
      • Exports
    32. 11.32

      South Africa

      • Market Size
      • Production
      • Imports
      • Exports
    33. 11.33

      Malaysia

      • Market Size
      • Production
      • Imports
      • Exports
    34. 11.34

      Israel

      • Market Size
      • Production
      • Imports
      • Exports
    35. 11.35

      Singapore

      • Market Size
      • Production
      • Imports
      • Exports
    36. 11.36

      Egypt

      • Market Size
      • Production
      • Imports
      • Exports
    37. 11.37

      Philippines

      • Market Size
      • Production
      • Imports
      • Exports
    38. 11.38

      Finland

      • Market Size
      • Production
      • Imports
      • Exports
    39. 11.39

      Chile

      • Market Size
      • Production
      • Imports
      • Exports
    40. 11.40

      Ireland

      • Market Size
      • Production
      • Imports
      • Exports
    41. 11.41

      Pakistan

      • Market Size
      • Production
      • Imports
      • Exports
    42. 11.42

      Greece

      • Market Size
      • Production
      • Imports
      • Exports
    43. 11.43

      Portugal

      • Market Size
      • Production
      • Imports
      • Exports
    44. 11.44

      Kazakhstan

      • Market Size
      • Production
      • Imports
      • Exports
    45. 11.45

      Algeria

      • Market Size
      • Production
      • Imports
      • Exports
    46. 11.46

      Czech Republic

      • Market Size
      • Production
      • Imports
      • Exports
    47. 11.47

      Qatar

      • Market Size
      • Production
      • Imports
      • Exports
    48. 11.48

      Peru

      • Market Size
      • Production
      • Imports
      • Exports
    49. 11.49

      Romania

      • Market Size
      • Production
      • Imports
      • Exports
    50. 11.50

      Vietnam

      • Market Size
      • Production
      • Imports
      • Exports
  12. LIST OF TABLES

    1. Key Findings In 2025
    2. Market Volume, In Physical Terms: Historical Data (2012–2025) and Forecast (2026–2035)
    3. Market Value: Historical Data (2012–2025) and Forecast (2026–2035)

    4. Per Capita Consumption, by Country, 2022–2025
    5. Production, In Physical Terms, By Country: Historical Data (2012–2025) and Forecast (2026–2035)
    6. Imports, In Physical Terms, By Country: Historical Data (2012–2025) and Forecast (2026–2035)
    7. Imports, In Value Terms, By Country: Historical Data (2012–2025) and Forecast (2026–2035)
    8. Import Prices, By Country: Historical Data (2012–2025) and Forecast (2026–2035)
    9. Exports, In Physical Terms, By Country: Historical Data (2012–2025) and Forecast (2026–2035)
    10. Exports, In Value Terms, By Country: Historical Data (2012–2025) and Forecast (2026–2035)
    11. Export Prices, By Country: Historical Data (2012–2025) and Forecast (2026–2035)
  13. LIST OF FIGURES

    1. Market Volume, In Physical Terms: Historical Data (2012–2025) and Forecast (2026–2035)
    2. Market Value: Historical Data (2012–2025) and Forecast (2026–2035)
    3. Consumption, by Country, 2025
    4. Market Volume Forecast to 2035
    5. Market Value Forecast to 2035
    6. Market Size and Growth, By Product
    7. Average Per Capita Consumption, By Product
    8. Exports and Growth, By Product
    9. Export Prices and Growth, By Product
    10. Production Volume and Growth
    11. Exports and Growth
    12. Export Prices and Growth
    13. Market Size and Growth
    14. Per Capita Consumption
    15. Imports and Growth
    16. Import Prices
    17. Production, In Physical Terms: Historical Data (2012–2025) and Forecast (2026–2035)
    18. Production, In Value Terms: Historical Data (2012–2025) and Forecast (2026–2035)
    19. Production, by Country, 2025
    20. Production, In Physical Terms, by Country: Historical Data (2012–2025) and Forecast (2026–2035)
    21. Imports, In Physical Terms: Historical Data (2012–2025) and Forecast (2026–2035)
    22. Imports, In Value Terms: Historical Data (2012–2025) and Forecast (2026–2035)
    23. Imports, In Physical Terms, By Country, 2025
    24. Imports, In Physical Terms, By Country: Historical Data (2012–2025) and Forecast (2026–2035)
    25. Imports, In Value Terms, By Country: Historical Data (2012–2025) and Forecast (2026–2035)
    26. Import Prices, By Country: Historical Data (2012–2025) and Forecast (2026–2035)
    27. Exports, In Physical Terms: Historical Data (2012–2025) and Forecast (2026–2035)
    28. Exports, In Value Terms: Historical Data (2012–2025) and Forecast (2026–2035)
    29. Exports, In Physical Terms, By Country, 2025
    30. Exports, In Physical Terms, By Country: Historical Data (2012–2025) and Forecast (2026–2035)
    31. Exports, In Value Terms, By Country: Historical Data (2012–2025) and Forecast (2026–2035)
    32. Export Prices, By Country: Historical Data (2012–2025) and Forecast (2026–2035)

Free Training

Source link

Shoals Technologies Group, Inc. Opens New Mega Facility in Portland, Tennessee, Reinforcing American Manufacturing and Energy Supply Chain


News Summary:


  • Shoals Technologies Group, Inc. opened its new 638,000-square-foot Mega Facility in Portland, Tennessee, bac


    ked by a $30 million investment.

  • The new campus expands domestic U.S. manufacturing capacity and strengthens the American supply chain to meet growing demand for solar, battery energy storage systems (BESS), and data center infrastructure.

  • The milestone also commemorates Shoals’ 30th anniversary and included a $20,000 donati


    on to Hands of Hope to support meals across Portland and Sumner County.

PORTLAND, Tenn., May 19, 2026 (GLOBE NEWSWIRE) —

Shoals Technologies Group, Inc.


(“Shoals”) (NASDAQ: SHLS), a global leader in electrical infrastructure solutions for the energy transition market, announced the grand opening of its new Mega Facility in Portland, Tennessee, marking a major milestone in the company’s continued investment in American manufacturing and the future of energy infrastructure.

Backed by a $30 million investment with a total commitment of up to $80 million over five years, the facility strengthens Shoals’ ability to deliver safe, efficient and reliable power infrastructure solutions across solar power, battery energy storage systems (BESS), and mission-critical facilities, including data centers. This investment comes as the need for resilient, domestically produced electrical infrastructure continues to grow across the United States.

“As demand for energy infrastructure continues to accelerate, this new Mega Facility allows Shoals to scale alongside our customers and meet the needs of a rapidly evolving energy landscape,” said Brandon Moss, chief executive officer at Shoals Technologies Group, Inc. “By expanding our domestic manufacturing footprint and bringing increased capacity, we are strengthening the American energy supply chain and enabling faster, more efficient energy deployment.”

Located at 1500 Shoals Way, the new 638,000-square-foot, state-of-the-art manufacturing campus consolidates Shoals’ three existing Tennessee facilities into one centralized location, significantly expanding production capacity, increasing automation in production and packaging, and leveraging operational efficiencies to support increasing demand across the energy sector.

The opening of the Mega Facility also coincides with Shoals’ 30th anniversary, celebrating three decades of innovation. On May 18, Shoals marked both milestones with a ribbon-cutting ceremony for its new Mega Facility and a $20,000 donation to Hands of Hope, helping provide meals to residents in Portland and across Sumner County. The donation underscores Shoals’ ongoing commitment to supporting the community that has played an important role in the company’s success over the past 30 years.

“Shoals’ 30th anniversary is a moment to celebrate both our company’s success and the people and communities who have helped make it possible,” said Mr. Moss. “The opening of our new Mega Facility is an investment in the future of energy infrastructure and a commitment to the Portland community, creating jobs and supporting local families through our donation to Hands of Hope as we look ahead to our next chapter of growth.”

For more information, visit:

www.shoals.com


.


About Shoals Technologies Group, Inc.


Shoals Technologies Group is a leading manufacturer of advanced electrical infrastructure solutions for mission-critical applications across utility‑scale solar, battery storage, and data center power systems. Since its founding in 1996, the Company has designed innovative technologies and systems solutions that allow its customers to substantially increase installation efficiency and safety while improving system performance and reliability at scale. Shoals Technologies Group is a recognized leader in the energy transition industry. For additional information, please visit:


https://www.shoals.com


.


MEDIA CONTACTS


Lindsey Williams

[email protected]

Kelly Nguyen

[email protected]


609-385-6701

Photos accompanying this announcement are available at


https://www.globenewswire.com/NewsRoom/AttachmentNg/11d9500b-0f99-40f8-b6fe-645ec168a555


https://www.globenewswire.com/NewsRoom/AttachmentNg/649e52d0-f9d8-45bb-9dc7-df495b8b3d37


https://www.globenewswire.com/NewsRoom/AttachmentNg/775e9125-7d3c-450a-8948-272e7dcaa58c

Free Training

Source link

Vance praises redistricting, touts efforts to bring manufacturing back to U.S. at Kansas City stop • Kansas Reflector


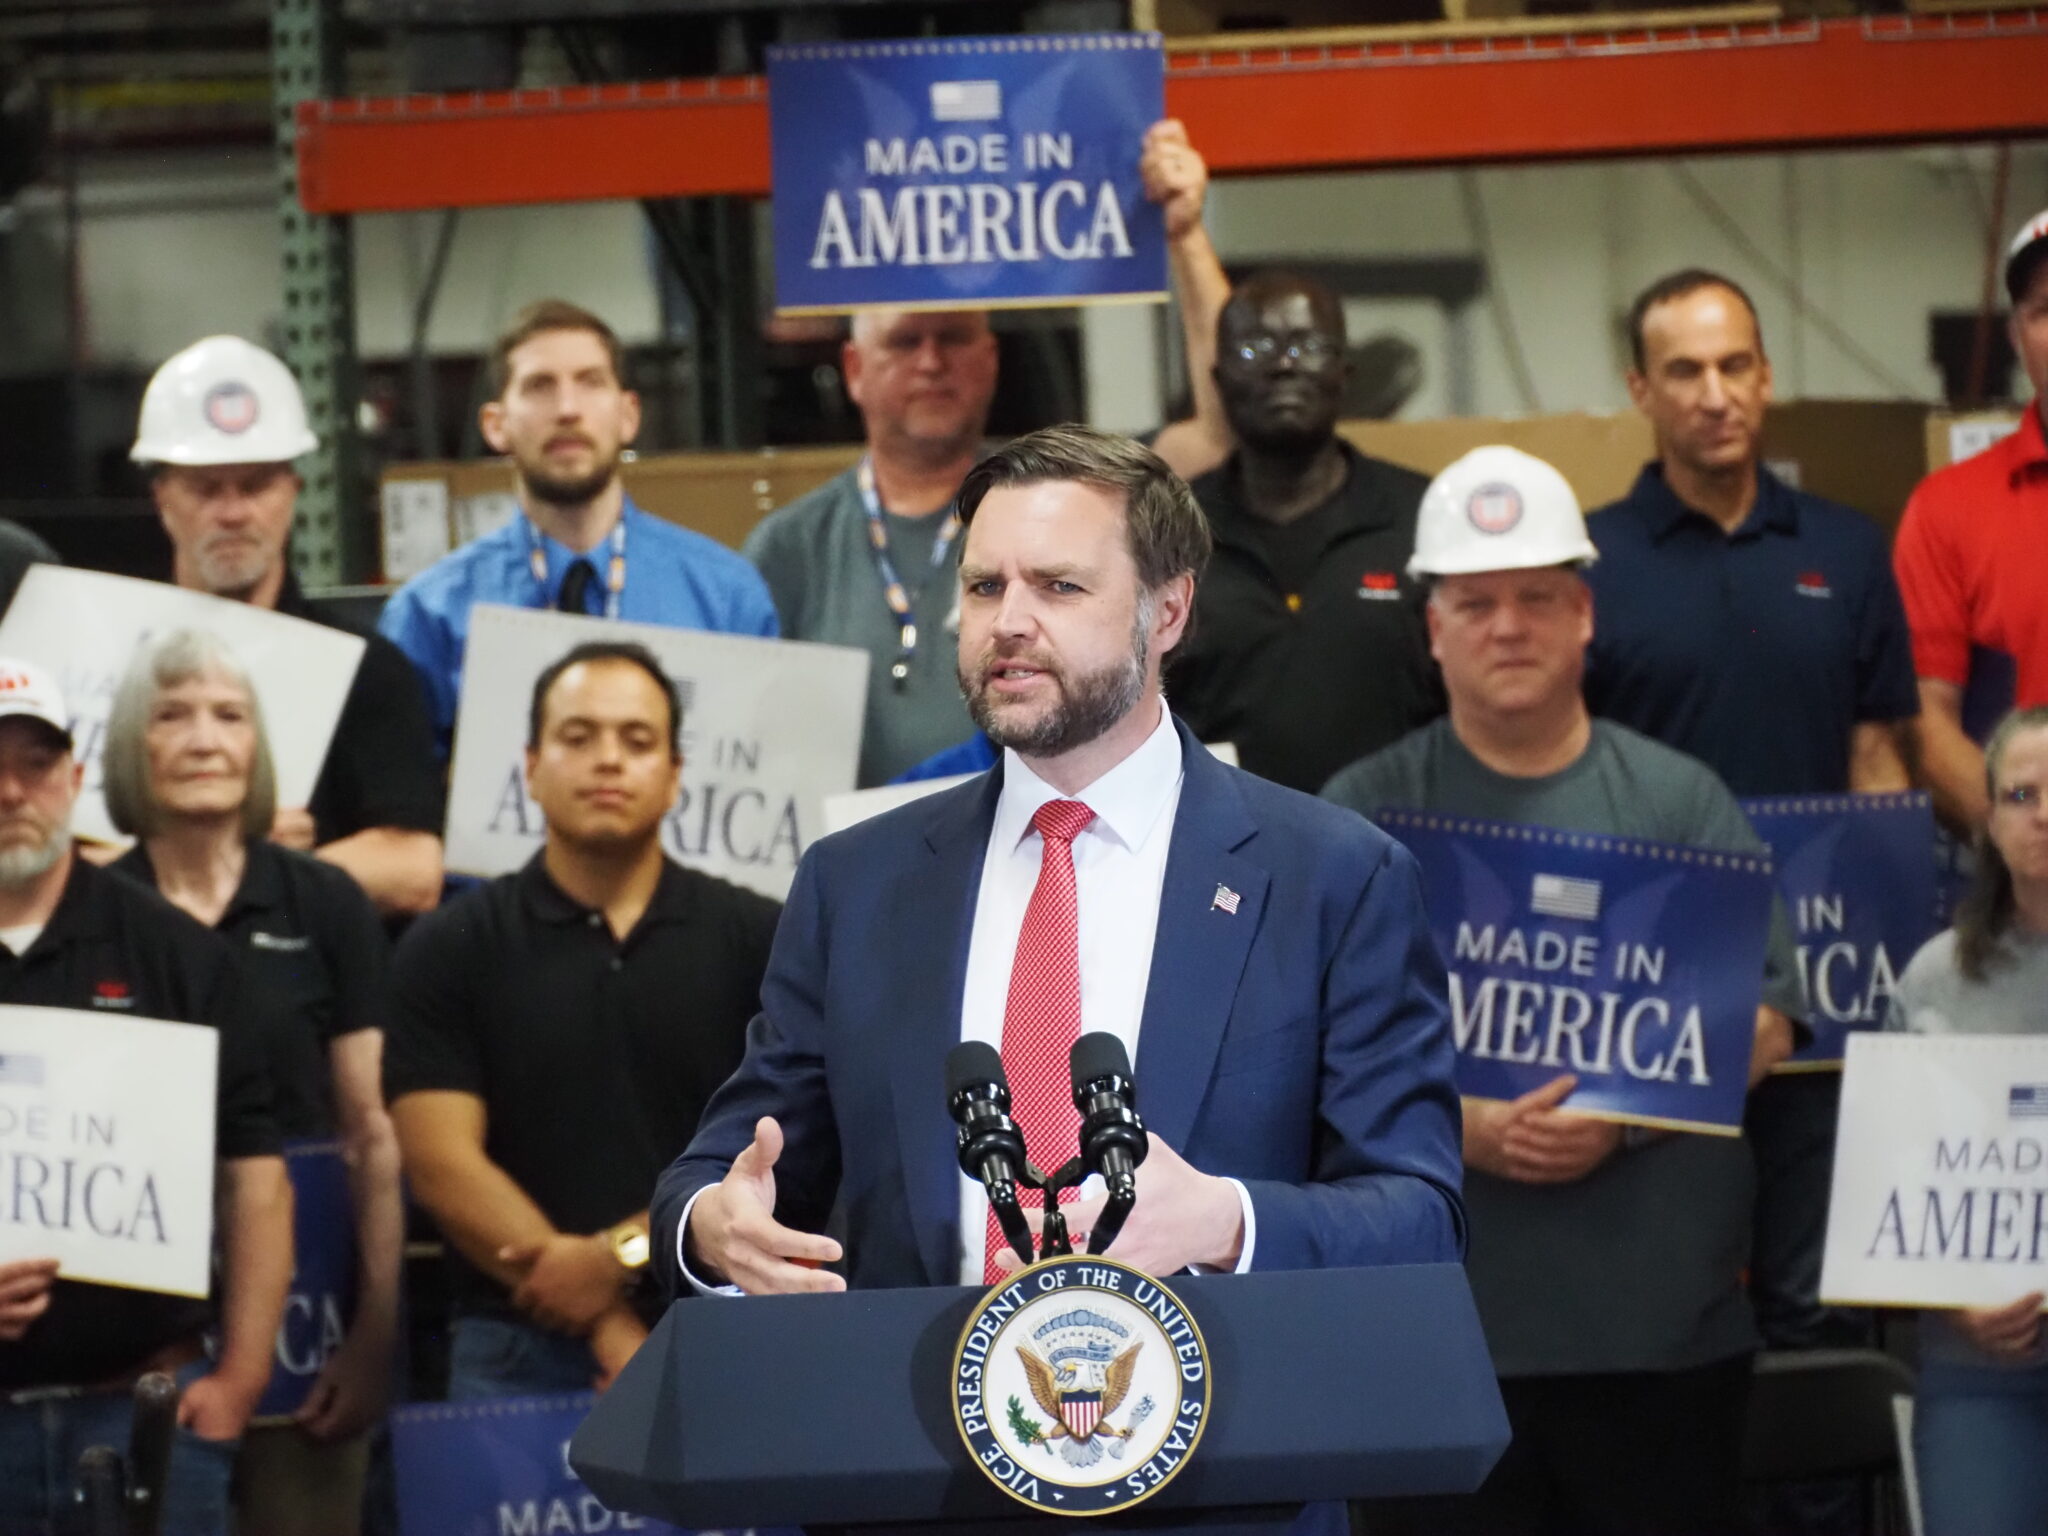
KANSAS CITY, Mo. — Vice President JD Vance ticked through a list of political topics — from Missouri’s redistricting efforts to the importance of bringing manufacturing back to the United States — at a campaign-style rally Monday afternoon. 

Vance spoke to a small, loud and enthusiastic crowd at a “protecting American workers” event, held at the nearly century-old Milbank Manufacturing company. 

The vice president praised President Donald Trump’s efforts to strengthen manufacturing, pointing to increased job growth and the “biggest growth in manufacturing employment last quarter” since Trump’s first term. 

The St. Louis Federal Reserve reported 12,596 manufacturing employees in April, slightly up after steady decreases since November 2024, when there were 12,711 such employees.  

Vance spoke about the One Big Beautiful Bill, renamed Working Families Tax Cut Act by Republicans, and its importance in lowering taxes, noting that all but one Democrat voted against it. As the crowd shouted in agreement, Vance said Republicans are the only party that fights to protect jobs and provide tax cuts for working-class Missourians. 

“I hate to say it, ladies and gentlemen — it is not the Democratic Party that my mamaw and papaw belonged to,” Vance said. “It’s not the Democratic Party that was patriotic and believed in supporting working people. It’s the Democratic party that has been given over, unfortunately, to a lot of crazy people.” 

Vance, and several politicians, including Missouri Gov. Mike Kehoe, spoke about the importance of the new Missouri congressional district maps, recently approved by the state’s Supreme Court for use in August elections. Milbank Manufacturing is located in the state’s 5th District, where Vance encouraged those in attendance to make sure a Republican is elected. 

“We’re rooting for any good Republican in this seat,” Vance said, adding that he was stepping into the role of “JD Vance, prophet” to say that any Democrat who promised to care about the people of Missouri would be pretending.

Missouri Gov. Mike Kehoe spoke at Milbank Manufacturing on May 18, 2026, before Vice President JD Vance took the stage to praise Trump administration efforts at supporting the manufacturing industry.Missouri Gov. Mike Kehoe spoke at Milbank Manufacturing on May 18, 2026, before Vice President JD Vance took the stage to praise Trump administration efforts at supporting the manufacturing industry. (Photo by Morgan Chilson/Kansas Reflector)


“In reality he’s going to get there and fight for Nancy Pelosi, because that’s what Congressional Democrats do,” Vance said.

Kehoe, who spoke before Vance, praised the “unbelievable congressional team” that represents Missouri’s values. Six of Missouri’s eight U.S. representatives are Republicans. 

“We now have the Missouri 1st map that gives us a chance at seven,” Kehoe said. The state’s redistricting efforts targeted Democratic Rep. Emanuel Cleaver’s seat. 

Vance continued to criticize Democrats as he talked about a program he heads that focuses on prosecuting people who commit fraud in government programs. He said Democrats only “get fired up” about “illegal aliens,” open borders and higher taxes. 

“I’m asking you to vote against Democrats because they don’t know who they fight for, or if they do know, they’re fighting for illegal aliens and they’re fighting for fraudsters,” Vance said. 

Dennis Slupski, who worked in manufacturing for 10 years and then as a teacher for 25 years, said he agreed with what Republican leaders said at the event, especially about bringing manufacturing back to the United States. 

The Kansas City, Kansas, man said he grew up in Ohio, known for its steel industry. 

“We had presidents and politicians that shipped our industry out of the country,” he said. The United States thrived as a manufacturing country during World War II, and it’s important to bring companies back to the country, Slupski said. 

Free Training

Source link

Philatron Delivers Shorter Lead Times Through U.S. Manufacturing


Domestic production strengthens supply-chain reliability and project continuity for OEMs and electrical distributors.

SANTA FE SPRINGS, Calif., May 18, 2026 /PRNewswire/ — Philatron Wire and Cable today announced a continued commitment to shorter lead times through U.S. manufacturing, helping customers navigate the ongoing challenges affecting global supply chains. By maintaining production in the United States, Philatron provides greater supply-chain stability, faster turnaround times, and responsive customer support for companies that rely on dependable cable and wire solutions.

Custom Electrical Cables USA Manufacturer Custom Electrical Cables USA Manufacturer

As global logistics disruptions continue to impact manufacturing schedules worldwide, Philatron’s U.S.-based production and engineering capabilities enable the company to deliver consistent lead times, clear communication, and flexible production adjustments when customer requirements evolve.

“Shorter lead times require control over the manufacturing process,” said Phillip Ramos, Jr., CEO of Philatron Wire and Cable. “By producing in the U.S., we can respond faster, coordinate directly with our customers, and adapt production schedules quickly when project demands change.”

Philatron’s domestic manufacturing model allows customers, including OEMs, electrical distributors, electrical contractors, military contractors, EV infrastructure developers, heavy-duty fleet operators, and data-center integrators, to benefit from:

  • Shorter production lead times compared to overseas sourcing

  • Improved supply-chain reliability through domestic manufacturing

  • Direct engineering communication for faster technical support

  • Flexible production scheduling when project requirements change

With certified quality systems including IATF 16949:2016 and ISO 9001:2015, Philatron continues to support industries that require high-performance extra-flexible large size power cables, retractile cables, EV charging cables, heavy-duty truck cables, military DTL-3432 cables, and specialized power distribution solutions.

By focusing on American manufacturing, engineering collaboration, and reliable delivery, Philatron helps customers maintain operational continuity even during periods of global supply-chain uncertainty.

About Philatron Wire and Cable

Philatron Wire and Cable has been a pioneer in American manufacturing for over 52 years producing high-performance wire and cable solutions, including retractile and custom cable systems for demanding applications across industries such as data centers, EV infrastructure, industrial equipment, robotics, military, and transportation systems. By maintaining strategic U.S.-based manufacturing, Philatron is able to support customers with more predictable lead times, responsive engineering coordination, and flexible production scheduling when project requirements evolve. Known for its innovation, engineering expertise, and commitment to quality, Philatron serves customers across transportation, energy, infrastructure, military, and advanced technology sectors, continuing to uphold the highest standards of performance, safety, and reliability as a trusted OEM partner in the global wire and cable industry..

Free Training

Source link

Inox Clean Energy’s $750M U.S. Solar Manufacturing Acquisition: 3 GW Module + 3 GW Cell Capacity – News and Statistics


May 16, 2026

Inox Clean Energy Ltd, the renewable energy arm of the Inoxgfl Group, has finalized the purchase of Boviet Solar’s manufacturing operations in North Carolina. This information was originally reported by pv magazine India.

Through its fully owned subsidiary Inox Solar Americas LLC, the company has added 3 GW of functioning TOPCon solar module production capacity to its holdings. Furthermore, a binding commitment exists to secure an extra 3 GW of TOPCon cell production capacity, which is slated to begin operations by the end of 2026. This deal is noted as one of the most significant purchases of U.S. renewable energy assets by an Indian firm.

The acquisition positions Inox Clean among the leading Indian integrated renewable energy manufacturers in the U.S. and marks a calculated entry into a rapidly expanding solar market. Inox Clean stated that the purchase unlocks considerable financial advantages through U.S. domestic manufacturing incentives. Goods produced at the site will be eligible for Section 45X tax credits, which the company says will bolster profitability and lower exposure to tariffs and policy uncertainties by relying on a domestic production base.

The company further explained that the acquisition offers an immediately available and expandable platform in a high-margin, policy-favorable environment. With existing cell supply constraints and the benefits of Section 45X creating advantageous conditions, Inox Clean believes it is well-placed to develop a comprehensive U.S. manufacturing network. The transaction was valued at roughly $750 million for the combined module and cell production assets, and it satisfies all requirements of the company’s valuation strategy.

In the preceding nine months, Inox Clean has carried out nine acquisitions in the independent power producer and solar cell and module manufacturing fields within India and abroad, including the purchases of Vibrant Energy, SkyPower, SunSource Energy, and Wind World India. The company aims to achieve 11 GW of integrated solar manufacturing capacity and 10 GW of operational IPP capacity by the fiscal year 2028, spanning India and key global markets such as the United States and Africa.

  1. 1. INTRODUCTION

    Making Data-Driven Decisions to Grow Your Business

    1. REPORT DESCRIPTION
    2. RESEARCH METHODOLOGY AND THE AI PLATFORM
    3. DATA-DRIVEN DECISIONS FOR YOUR BUSINESS
    4. GLOSSARY AND SPECIFIC TERMS
  2. 2. EXECUTIVE SUMMARY

    A Quick Overview of Market Performance

    1. KEY FINDINGS
    2. MARKET TRENDS This Chapter is Available Only for the Professional EditionPRO
  3. 3. MARKET OVERVIEW

    Understanding the Current State of The Market and its Prospects

    1. MARKET SIZE: HISTORICAL DATA (2012–2025) AND FORECAST (2026–2035)
    2. CONSUMPTION BY COUNTRY: HISTORICAL DATA (2012–2025) AND FORECAST (2026–2035)
    3. MARKET FORECAST TO 2035
  4. 4. MOST PROMISING PRODUCTS FOR DIVERSIFICATION

    Finding New Products to Diversify Your Business

    1. TOP PRODUCTS TO DIVERSIFY YOUR BUSINESS
    2. BEST-SELLING PRODUCTS
    3. MOST CONSUMED PRODUCTS
    4. MOST TRADED PRODUCTS
    5. MOST PROFITABLE PRODUCTS FOR EXPORT
  5. 5. MOST PROMISING SUPPLYING COUNTRIES

    Choosing the Best Countries to Establish Your Sustainable Supply Chain

    1. TOP COUNTRIES TO SOURCE YOUR PRODUCT
    2. TOP PRODUCING COUNTRIES
    3. TOP EXPORTING COUNTRIES
    4. LOW-COST EXPORTING COUNTRIES
  6. 6. MOST PROMISING OVERSEAS MARKETS

    Choosing the Best Countries to Boost Your Export

    1. TOP OVERSEAS MARKETS FOR EXPORTING YOUR PRODUCT
    2. TOP CONSUMING MARKETS
    3. UNSATURATED MARKETS
    4. TOP IMPORTING MARKETS
    5. MOST PROFITABLE MARKETS
  7. 7. PRODUCTION

    The Latest Trends and Insights into The Industry

    1. PRODUCTION VOLUME AND VALUE: HISTORICAL DATA (2012–2025) AND FORECAST (2026–2035)
    2. PRODUCTION BY COUNTRY: HISTORICAL DATA (2012–2025) AND FORECAST (2026–2035)
  8. 8. IMPORTS

    The Largest Import Supplying Countries

    1. IMPORTS: HISTORICAL DATA (2012–2025) AND FORECAST (2026–2035)
    2. IMPORTS BY COUNTRY: HISTORICAL DATA (2012–2025) AND FORECAST (2026–2035)
    3. IMPORT PRICES BY COUNTRY: HISTORICAL DATA (2012–2025) AND FORECAST (2026–2035)
  9. 9. EXPORTS

    The Largest Destinations for Exports

    1. EXPORTS: HISTORICAL DATA (2012–2025) AND FORECAST (2026–2035)
    2. EXPORTS BY COUNTRY: HISTORICAL DATA (2012–2025) AND FORECAST (2026–2035)
    3. EXPORT PRICES BY COUNTRY: HISTORICAL DATA (2012–2025) AND FORECAST (2026–2035)
  10. 10. PROFILES OF MAJOR PRODUCERS

    The Largest Producers on The Market and Their Profiles

  11. 11. COUNTRY PROFILES

    The Largest Markets And Their Profiles

    This Chapter is Available Only for the Professional Edition
    PRO

    1. 11.1

      United States

      • Market Size
      • Production
      • Imports
      • Exports
    2. 11.2

      China

      • Market Size
      • Production
      • Imports
      • Exports
    3. 11.3

      Japan

      • Market Size
      • Production
      • Imports
      • Exports
    4. 11.4

      Germany

      • Market Size
      • Production
      • Imports
      • Exports
    5. 11.5

      United Kingdom

      • Market Size
      • Production
      • Imports
      • Exports
    6. 11.6

      France

      • Market Size
      • Production
      • Imports
      • Exports
    7. 11.7

      Brazil

      • Market Size
      • Production
      • Imports
      • Exports
    8. 11.8

      Italy

      • Market Size
      • Production
      • Imports
      • Exports
    9. 11.9

      Russian Federation

      • Market Size
      • Production
      • Imports
      • Exports
    10. 11.10

      India

      • Market Size
      • Production
      • Imports
      • Exports
    11. 11.11

      Canada

      • Market Size
      • Production
      • Imports
      • Exports
    12. 11.12

      Australia

      • Market Size
      • Production
      • Imports
      • Exports
    13. 11.13

      Republic of Korea

      • Market Size
      • Production
      • Imports
      • Exports
    14. 11.14

      Spain

      • Market Size
      • Production
      • Imports
      • Exports
    15. 11.15

      Mexico

      • Market Size
      • Production
      • Imports
      • Exports
    16. 11.16

      Indonesia

      • Market Size
      • Production
      • Imports
      • Exports
    17. 11.17

      Netherlands

      • Market Size
      • Production
      • Imports
      • Exports
    18. 11.18

      Turkey

      • Market Size
      • Production
      • Imports
      • Exports
    19. 11.19

      Saudi Arabia

      • Market Size
      • Production
      • Imports
      • Exports
    20. 11.20

      Switzerland

      • Market Size
      • Production
      • Imports
      • Exports
    21. 11.21

      Sweden

      • Market Size
      • Production
      • Imports
      • Exports
    22. 11.22

      Nigeria

      • Market Size
      • Production
      • Imports
      • Exports
    23. 11.23

      Poland

      • Market Size
      • Production
      • Imports
      • Exports
    24. 11.24

      Belgium

      • Market Size
      • Production
      • Imports
      • Exports
    25. 11.25

      Argentina

      • Market Size
      • Production
      • Imports
      • Exports
    26. 11.26

      Norway

      • Market Size
      • Production
      • Imports
      • Exports
    27. 11.27

      Austria

      • Market Size
      • Production
      • Imports
      • Exports
    28. 11.28

      Thailand

      • Market Size
      • Production
      • Imports
      • Exports
    29. 11.29

      United Arab Emirates

      • Market Size
      • Production
      • Imports
      • Exports
    30. 11.30

      Colombia

      • Market Size
      • Production
      • Imports
      • Exports
    31. 11.31

      Denmark

      • Market Size
      • Production
      • Imports
      • Exports
    32. 11.32

      South Africa

      • Market Size
      • Production
      • Imports
      • Exports
    33. 11.33

      Malaysia

      • Market Size
      • Production
      • Imports
      • Exports
    34. 11.34

      Israel

      • Market Size
      • Production
      • Imports
      • Exports
    35. 11.35

      Singapore

      • Market Size
      • Production
      • Imports
      • Exports
    36. 11.36

      Egypt

      • Market Size
      • Production
      • Imports
      • Exports
    37. 11.37

      Philippines

      • Market Size
      • Production
      • Imports
      • Exports
    38. 11.38

      Finland

      • Market Size
      • Production
      • Imports
      • Exports
    39. 11.39

      Chile

      • Market Size
      • Production
      • Imports
      • Exports
    40. 11.40

      Ireland

      • Market Size
      • Production
      • Imports
      • Exports
    41. 11.41

      Pakistan

      • Market Size
      • Production
      • Imports
      • Exports
    42. 11.42

      Greece

      • Market Size
      • Production
      • Imports
      • Exports
    43. 11.43

      Portugal

      • Market Size
      • Production
      • Imports
      • Exports
    44. 11.44

      Kazakhstan

      • Market Size
      • Production
      • Imports
      • Exports
    45. 11.45

      Algeria

      • Market Size
      • Production
      • Imports
      • Exports
    46. 11.46

      Czech Republic

      • Market Size
      • Production
      • Imports
      • Exports
    47. 11.47

      Qatar

      • Market Size
      • Production
      • Imports
      • Exports
    48. 11.48

      Peru

      • Market Size
      • Production
      • Imports
      • Exports
    49. 11.49

      Romania

      • Market Size
      • Production
      • Imports
      • Exports
    50. 11.50

      Vietnam

      • Market Size
      • Production
      • Imports
      • Exports
  12. LIST OF TABLES

    1. Key Findings In 2025
    2. Market Volume, In Physical Terms: Historical Data (2012–2025) and Forecast (2026–2035)
    3. Market Value: Historical Data (2012–2025) and Forecast (2026–2035)
    4. Per Capita Consumption, by Country, 2022–2025
    5. Production, In Physical Terms, By Country: Historical Data (2012–2025) and Forecast (2026–2035)
    6. Imports, In Physical Terms, By Country: Historical Data (2012–2025) and Forecast (2026–2035)
    7. Imports, In Value Terms, By Country: Historical Data (2012–2025) and Forecast (2026–2035)
    8. Import Prices, By Country: Historical Data (2012–2025) and Forecast (2026–2035)
    9. Exports, In Physical Terms, By Country: Historical Data (2012–2025) and Forecast (2026–2035)
    10. Exports, In Value Terms, By Country: Historical Data (2012–2025) and Forecast (2026–2035)
    11. Export Prices, By Country: Historical Data (2012–2025) and Forecast (2026–2035)
  13. LIST OF FIGURES

    1. Market Volume, In Physical Terms: Historical Data (2012–2025) and Forecast (2026–2035)
    2. Market Value: Historical Data (2012–2025) and Forecast (2026–2035)
    3. Consumption, by Country, 2025
    4. Market Volume Forecast to 2035
    5. Market Value Forecast to 2035
    6. Market Size and Growth, By Product
    7. Average Per Capita Consumption, By Product
    8. Exports and Growth, By Product
    9. Export Prices and Growth, By Product
    10. Production Volume and Growth
    11. Exports and Growth
    12. Export Prices and Growth
    13. Market Size and Growth
    14. Per Capita Consumption
    15. Imports and Growth
    16. Import Prices
    17. Production, In Physical Terms: Historical Data (2012–2025) and Forecast (2026–2035)
    18. Production, In Value Terms: Historical Data (2012–2025) and Forecast (2026–2035)
    19. Production, by Country, 2025
    20. Production, In Physical Terms, by Country: Historical Data (2012–2025) and Forecast (2026–2035)
    21. Imports, In Physical Terms: Historical Data (2012–2025) and Forecast (2026–2035)
    22. Imports, In Value Terms: Historical Data (2012–2025) and Forecast (2026–2035)
    23. Imports, In Physical Terms, By Country, 2025
    24. Imports, In Physical Terms, By Country: Historical Data (2012–2025) and Forecast (2026–2035)
    25. Imports, In Value Terms, By Country: Historical Data (2012–2025) and Forecast (2026–2035)
    26. Import Prices, By Country: Historical Data (2012–2025) and Forecast (2026–2035)
    27. Exports, In Physical Terms: Historical Data (2012–2025) and Forecast (2026–2035)
    28. Exports, In Value Terms: Historical Data (2012–2025) and Forecast (2026–2035)
    29. Exports, In Physical Terms, By Country, 2025
    30. Exports, In Physical Terms, By Country: Historical Data (2012–2025) and Forecast (2026–2035)
    31. Exports, In Value Terms, By Country: Historical Data (2012–2025) and Forecast (2026–2035)
    32. Export Prices, By Country: Historical Data (2012–2025) and Forecast (2026–2035)

Free Training

Source link

Toyota Plans $2bn Texas Expansion as Automakers Deepen North American Manufacturing Push


Toyota Plans $2bn Texas Expansion as Automakers Deepen North American Manufacturing Push

Toyota Motor Corporation is seeking approval to build a new vehicle assembly line at its manufacturing complex in Texas as the Japanese automaker accelerates long-term investment in North American production amid intensifying competition in trucks, electric vehicles, and regional supply-chain localization.

According to a filing with the Texas Comptroller of Public Accounts, Toyota plans to invest roughly $2 billion in the proposed expansion project, internally named “Project Orca,” at its existing San Antonio manufacturing site. The filing shows construction is expected to begin by the end of 2026, while vehicle production at the new assembly line is targeted to commence in 2030.

Toyota plans to spend approximately $1.05 billion on buildings and property improvements, alongside another $950 million dedicated to machinery and manufacturing equipment. The project is also expected to create about 2,000 new jobs between 2028 and 2030, adding to Toyota’s already substantial employment footprint in Texas and reinforcing the growing importance of the southern United States in the global automotive industry.

In a statement to Reuters, Toyota said, “We regularly evaluate our manufacturing footprint to ensure we remain competitive and aligned with customer demand. This reflects our long-term commitment to investing in the North American region, local manufacturing/jobs, and suppliers.”

Toyota’s San Antonio facility has historically focused heavily on pickup truck production, including the Toyota Tundra and Toyota Sequoia, two models central to the company’s efforts to compete in the highly profitable North American truck and SUV market. The new assembly line could significantly expand Toyota’s ability to serve U.S. demand locally at a time when automakers are under growing pressure to shorten supply chains and reduce exposure to overseas manufacturing risks.

Texas has become increasingly attractive to automakers and industrial manufacturers because of its large labor market, logistics infrastructure, relatively lower operating costs, and business-friendly regulatory environment. The state is also emerging as a major center for energy-intensive industries, including electric vehicles, semiconductors, and artificial intelligence data centers.

Toyota’s investment adds to a broader wave of manufacturing expansion across the southern United States, where automakers are pouring billions into new factories, battery plants, and supplier networks. The region has become particularly important as companies attempt to comply with North American sourcing requirements tied to trade incentives and industrial policies in both the United States and Canada.

The timing of Toyota’s proposed expansion is notable because it comes during one of the most significant transitions in automotive history. The industry is simultaneously managing the shift toward electrification, the rise of software-defined vehicles, growing competition from Chinese manufacturers, and changing consumer demand patterns.

While Toyota was initially criticized by some investors and environmental groups for moving more cautiously on fully electric vehicles than rivals such as Tesla or BYD, the company has increasingly accelerated investment across hybrid, battery-electric, and hydrogen technologies.

At the same time, Toyota has maintained a strong focus on profitability and production discipline, particularly in trucks and hybrid vehicles, where demand remains resilient. The company’s continued investment in U.S. manufacturing suggests it expects North America to remain one of its most important long-term growth markets regardless of how rapidly electrification evolves.

Industry analysts believe that local manufacturing has become strategically more important for automakers following the supply-chain shocks triggered by the COVID-19 pandemic and geopolitical tensions between the United States and China. Semiconductor shortages, shipping disruptions, and rising trade frictions exposed vulnerabilities in globally dispersed production networks, pushing many manufacturers to localize more operations closer to major consumer markets.

Toyota’s Texas expansion fits squarely within that broader industrial realignment.

The planned investment also reflects the enormous capital requirements now confronting global automakers. Companies are simultaneously funding traditional internal combustion production, electric vehicle development, battery manufacturing, software systems, and advanced automation technologies.

For Toyota, maintaining a competitive scale in North America is especially important because the region remains one of the company’s largest profit generators, particularly in larger vehicles and hybrid models.

The proposed spending on machinery and equipment indicates the new line could incorporate significant automation and advanced manufacturing technologies designed to improve efficiency and production flexibility.

Modern vehicle plants increasingly rely on robotics, AI-assisted quality systems, and digitally integrated supply-chain management tools to manage rising production complexity.

Toyota has historically been regarded as one of the world’s leading manufacturing companies through its “Toyota Production System,” which revolutionized lean manufacturing and operational efficiency across the global auto industry. The San Antonio expansion, therefore, likely represents not just additional capacity, but also another phase in Toyota’s modernization of North American operations.

Like this:

Like Loading…


Free Training

Source link

America doubling down on the past — again


The United States is doubling down on yesterday’s manufacturing strategy at the very moment the world is racing toward tomorrow.

That is the core flaw in the manufacturing approach associated with Donald Trump. It mirrors his energy policy: just as he has leaned into fossil fuels while the global economy pivots toward clean energy, his manufacturing vision leans toward reviving legacy industries while the rest of the world builds the future.

This is not a question of whether manufacturing matters. It does. Deeply. The question is what kind of manufacturing the United States should lead — and what kind it should let go.

Right now, we are answering that question poorly.

The current approach is built around tariffs, protection, and the idea that we can broadly “bring manufacturing back.” It sounds strong. It polls well. But it misunderstands how modern manufacturing actually works.

Manufacturing is no longer a single, national activity. It is a global system. Supply chains stretch across continents. Components cross borders multiple times before final assembly. Labor, capital, and expertise are distributed based on cost, capability, and specialization.

Trying to pull all of that back within U.S. borders is not strategy. It is nostalgia. And nostalgia is not a growth plan.

The real question is not whether something is made in America. It is what is made in America.

The United States should be the global leader in:

semiconductors

advanced materials

precision manufacturing

AI-enabled production

clean and high-tech industrial systems

These are the industries where:

productivity is highest

wages are highest

environmental impact is lowest

strategic leverage is greatest

These are the factories where workers earn $100,000 a year — not because of protection, but because of skill, technology, and value creation.

That is the future of manufacturing. And that is where the United States should dominate.

At the same time, we need to be honest about what doesn’t belong at the center of U.S. manufacturing strategy.

Labor-intensive, low-margin production — textiles, basic assembly, commodity goods — will continue to migrate to regions with lower labor costs. That is not failure. That is how global economics works.

The goal is not to win every factory. The goal is to win the most important factories.

A serious manufacturing policy would make that distinction clearly and unapologetically.

While the U.S. debates tariffs, China is building capacity.

It is scaling

solar panels

wind turbines

batteries

electric vehicles.

In other words, China is manufacturing the infrastructure of the future global economy.

The risk is not just environmental. It is strategic and economic obsolescence.

If the United States focuses on protecting legacy industries while China dominates next-generation ones, we are not competing — we are conceding.

There is one clear exception to all of this: national security.

Certain industries must be anchored domestically: defense systems, critical infrastructure components, advanced chips and essential medical supplies

In these areas, resilience matters more than efficiency. Redundancy matters more than cost.

But outside of those domains, the goal should not be blanket reshoring. It should be strategic leadership.

The United States faces a simple but consequential choice:

We can try to rebuild the past — protecting industries that are declining globally, raising costs at home, and falling behind in the sectors that will define the next century.

Or we can build the future — investing in advanced manufacturing, aligning education with high-skill production, and competing where it actually matters.

Right now, we are leaning toward the first path.

Because in both energy and manufacturing, the same pattern is emerging: doubling down on what used to work, while the rest of the world moves on.

And in a global economy that rewards innovation, speed, and scale, that is not just a missed opportunity.

It is a strategic mistake.

Ed Gaskin is Executive Director of Greater Grove Hall Main Streets and founder of Sunday Celebrations

TOPSHOT - US President Donald Trump (C) shows his signature on the "Big Beautiful Bill Act" at the White House in Washington, DC, on July 4, 2025. US President Donald Trump signed his flagship tax and spending bill on July 4 in a pomp-laden Independence Day ceremony featuring fireworks and a flypast by the type of stealth bomber that bombed Iran. Trump pushed Republican lawmakers to get his unpopular "One Big Beautiful Bill" through a reluctant Congress in time for him to sign it into law on the US national holiday -- and they did so with a day to spare Thursday. (Photo by Brendan SMIALOWSKI / POOL / AFP) (Photo by BRENDAN SMIALOWSKI/POOL/AFP via Getty Images)President Donald Trump shows his signature on the “Big Beautiful Bill Act” at the White House in Washington, DC, last year. (Photo by BRENDAN SMIALOWSKI/POOL/AFP via Getty Images)


Free Training

Source link

Huntsman’s Outlook Shifts As US Manufacturing And Aerospace Demand Rebound


  • Huntsman (NYSE:HUN) is seeing renewed growth prospects as U.S. manufacturing activity and aerospace demand pick up.
  • Reshoring incentives, new refrigerant rules, electric vehicle growth and stronger aerospace orders are cited as key demand drivers for Huntsman’s polyurethanes and advanced materials.
  • This shift highlights both improving profitability prospects for Huntsman and ongoing exposure to feedstock volatility and leverage risk.

For investors tracking NYSE:HUN, the stock trades around $13.7, with the share price up 34.4% year to date and 14.9% over the past year, while still down 37.5% over three years and 41.4% over five years. That pattern underlines how Huntsman has been rebuilding from a weaker multi year stretch, with recent U.S. manufacturing and aerospace trends giving fresh attention to its core polyurethanes and advanced materials businesses.

The renewed interest in reshoring, cleaner refrigerants and EV components could shift Huntsman’s risk and opportunity mix, with more exposure to U.S. industrial and aerospace cycles. At the same time, investors still need to keep an eye on feedstock pricing and balance sheet leverage, which remain central to how this new demand backdrop may translate into future returns.

Stay updated on the most important news stories for Huntsman by adding it to your watchlist or portfolio. Alternatively, explore our Community to discover new perspectives on Huntsman.

NYSE:HUN Earnings & Revenue Growth as at May 2026NYSE:HUN Earnings & Revenue Growth as at May 2026

We’ve flagged 2 risks for Huntsman. See which could impact your investment.

Quick Assessment

  • ⚖️ Price vs Analyst Target: At US$13.70, HUN trades about 3.7% below the US$14.23 analyst target, which sits comfortably within the typical one standard deviation range of US$12.15 to US$16.31.
  • ❌ Simply Wall St Valuation: The stock is flagged as overvalued, trading 61.1% above the Simply Wall St estimated fair value.
  • ✅ Recent Momentum: The 30 day return of 0.8% lines up with the renewed interest in Huntsman as U.S. manufacturing and aerospace orders pick up.

There is only one way to know the right time to buy, sell or hold Huntsman. Head to Simply Wall St’s
company report for the latest analysis of Huntsman’s Fair Value.

Key Considerations

  • 📊 Reshoring and stronger aerospace demand tie HUN more closely to U.S. industrial cycles, while the stock already trades below the average analyst target.
  • 📊 Watch how revenue, margins and cash flow respond to higher volumes in polyurethanes and advanced materials, given the current P/E of 7.4 times earnings reported as a loss.
  • ⚠️ The company reports a net loss of US$323.0m and its debt is not well covered by operating cash flow, so balance sheet strength is critical if the upturn stalls.

Dig Deeper

For the full picture including more risks and rewards, check out the
complete Huntsman analysis. Alternatively, you can check out the
community page for Huntsman to see how other investors believe this latest news will impact the company’s narrative.

This article by Simply Wall St is general in nature. We provide commentary based on historical data
and analyst forecasts only using an unbiased methodology and our articles are not intended to be financial advice.
It does not constitute a recommendation to buy or sell any stock, and does not take account of your objectives, or your
financial situation. We aim to bring you long-term focused analysis driven by fundamental data.
Note that our analysis may not factor in the latest price-sensitive company announcements or qualitative material.
Simply Wall St has no position in any stocks mentioned.

Valuation is complex, but we’re here to simplify it.

Discover if Huntsman might be undervalued or overvalued with our detailed analysis, featuring fair value estimates, potential risks, dividends, insider trades, and its financial condition.

Access Free Analysis

Have feedback on this article? Concerned about the content? Get in touch with us directly. Alternatively, email editorial-team@simplywallst.com

Free Training

Source link

Gold Faces Headwinds as Empire State Manufacturing Survey Rises: Market Analysis 2026 – News and Statistics


May 16, 2026

A recent report from the New York Federal Reserve indicated a rise in the Empire State Manufacturing Survey, a development that could create additional headwinds for gold prices. The source of this information is Neils Christensen, a journalist with a diploma in journalism from Lethbridge College and over a decade of reporting experience for news organizations across Canada, who now works exclusively in the financial sector.

The survey data is closely tied to broader discussions around US monetary policy, US interest rates, US inflation, and US economic activity, particularly within the US manufacturing sector. According to the source material, the increase in the manufacturing survey suggests that gold may face further downward pressure, as stronger economic data can influence central bank policy decisions.

Other recent market commentary has included predictions that the US debt crisis, which has reached $40 trillion, is setting the stage for gold to potentially reach $17,250 per ounce. Additionally, separate analysis has suggested that gold could navigate near-term challenges to achieve a price of $5,000 per ounce by the end of the year. In the silver market, prices have surged above $80, with analysts attributing this move to a structural shift in the global economy. Meanwhile, spot silver has experienced a surge, and gold prices have firmed, even as a CPI risk has lifted yields. Gold prices have also been supported by optimism regarding Iran, despite ongoing import issues in India, and silver producers have reported strong output in 2026.

  1. 1. INTRODUCTION

    Making Data-Driven Decisions to Grow Your Business

    1. REPORT DESCRIPTION
    2. RESEARCH METHODOLOGY AND THE AI PLATFORM
    3. DATA-DRIVEN DECISIONS FOR YOUR BUSINESS
    4. GLOSSARY AND SPECIFIC TERMS
  2. 2. EXECUTIVE SUMMARY

    A Quick Overview of Market Performance

    1. KEY FINDINGS
    2. MARKET TRENDS This Chapter is Available Only for the Professional EditionPRO
  3. 3. MARKET OVERVIEW

    Understanding the Current State of The Market and its Prospects

    1. MARKET SIZE: HISTORICAL DATA (2012–2025) AND FORECAST (2026–2035)
    2. CONSUMPTION BY COUNTRY: HISTORICAL DATA (2012–2025) AND FORECAST (2026–2035)
    3. MARKET FORECAST TO 2035
  4. 4. MOST PROMISING PRODUCTS FOR DIVERSIFICATION

    Finding New Products to Diversify Your Business

    1. TOP PRODUCTS TO DIVERSIFY YOUR BUSINESS
    2. BEST-SELLING PRODUCTS
    3. MOST CONSUMED PRODUCTS
    4. MOST TRADED PRODUCTS
    5. MOST PROFITABLE PRODUCTS FOR EXPORT
  5. 5. MOST PROMISING SUPPLYING COUNTRIES

    Choosing the Best Countries to Establish Your Sustainable Supply Chain

    1. TOP COUNTRIES TO SOURCE YOUR PRODUCT
    2. TOP PRODUCING COUNTRIES
    3. TOP EXPORTING COUNTRIES
    4. LOW-COST EXPORTING COUNTRIES
  6. 6. MOST PROMISING OVERSEAS MARKETS

    Choosing the Best Countries to Boost Your Export

    1. TOP OVERSEAS MARKETS FOR EXPORTING YOUR PRODUCT
    2. TOP CONSUMING MARKETS
    3. UNSATURATED MARKETS
    4. TOP IMPORTING MARKETS
    5. MOST PROFITABLE MARKETS
  7. 7. PRODUCTION

    The Latest Trends and Insights into The Industry

    1. PRODUCTION VOLUME AND VALUE: HISTORICAL DATA (2012–2025) AND FORECAST (2026–2035)
    2. PRODUCTION BY COUNTRY: HISTORICAL DATA (2012–2025) AND FORECAST (2026–2035)
  8. 8. IMPORTS

    The Largest Import Supplying Countries

    1. IMPORTS: HISTORICAL DATA (2012–2025) AND FORECAST (2026–2035)
    2. IMPORTS BY COUNTRY: HISTORICAL DATA (2012–2025) AND FORECAST (2026–2035)
    3. IMPORT PRICES BY COUNTRY: HISTORICAL DATA (2012–2025) AND FORECAST (2026–2035)
  9. 9. EXPORTS

    The Largest Destinations for Exports

    1. EXPORTS: HISTORICAL DATA (2012–2025) AND FORECAST (2026–2035)
    2. EXPORTS BY COUNTRY: HISTORICAL DATA (2012–2025) AND FORECAST (2026–2035)
    3. EXPORT PRICES BY COUNTRY: HISTORICAL DATA (2012–2025) AND FORECAST (2026–2035)
  10. 10. PROFILES OF MAJOR PRODUCERS

    The Largest Producers on The Market and Their Profiles

  11. 11. COUNTRY PROFILES

    The Largest Markets And Their Profiles

    This Chapter is Available Only for the Professional Edition
    PRO

    1. 11.1

      United States

      • Market Size
      • Production
      • Imports
      • Exports
    2. 11.2

      China

      • Market Size
      • Production
      • Imports
      • Exports
    3. 11.3

      Japan

      • Market Size
      • Production
      • Imports
      • Exports
    4. 11.4

      Germany

      • Market Size
      • Production
      • Imports
      • Exports
    5. 11.5

      United Kingdom

      • Market Size
      • Production
      • Imports
      • Exports
    6. 11.6

      France

      • Market Size
      • Production
      • Imports
      • Exports
    7. 11.7

      Brazil

      • Market Size
      • Production
      • Imports
      • Exports
    8. 11.8

      Italy

      • Market Size
      • Production
      • Imports
      • Exports
    9. 11.9

      Russian Federation

      • Market Size
      • Production
      • Imports
      • Exports
    10. 11.10

      India

      • Market Size
      • Production
      • Imports
      • Exports
    11. 11.11

      Canada

      • Market Size
      • Production
      • Imports
      • Exports
    12. 11.12

      Australia

      • Market Size
      • Production
      • Imports
      • Exports
    13. 11.13

      Republic of Korea

      • Market Size
      • Production
      • Imports
      • Exports
    14. 11.14

      Spain

      • Market Size
      • Production
      • Imports
      • Exports
    15. 11.15

      Mexico

      • Market Size
      • Production
      • Imports
      • Exports
    16. 11.16

      Indonesia

      • Market Size
      • Production
      • Imports
      • Exports
    17. 11.17

      Netherlands

      • Market Size
      • Production
      • Imports
      • Exports
    18. 11.18

      Turkey

      • Market Size
      • Production
      • Imports
      • Exports
    19. 11.19

      Saudi Arabia

      • Market Size
      • Production
      • Imports
      • Exports
    20. 11.20

      Switzerland

      • Market Size
      • Production
      • Imports
      • Exports
    21. 11.21

      Sweden

      • Market Size
      • Production
      • Imports
      • Exports
    22. 11.22

      Nigeria

      • Market Size
      • Production
      • Imports
      • Exports
    23. 11.23

      Poland

      • Market Size
      • Production
      • Imports
      • Exports
    24. 11.24

      Belgium

      • Market Size
      • Production
      • Imports
      • Exports
    25. 11.25

      Argentina

      • Market Size
      • Production
      • Imports
      • Exports
    26. 11.26

      Norway

      • Market Size
      • Production
      • Imports
      • Exports
    27. 11.27

      Austria

      • Market Size
      • Production
      • Imports
      • Exports
    28. 11.28

      Thailand

      • Market Size
      • Production
      • Imports
      • Exports
    29. 11.29

      United Arab Emirates

      • Market Size
      • Production
      • Imports
      • Exports
    30. 11.30

      Colombia

      • Market Size
      • Production
      • Imports
      • Exports
    31. 11.31

      Denmark

      • Market Size
      • Production
      • Imports
      • Exports
    32. 11.32

      South Africa

      • Market Size
      • Production
      • Imports
      • Exports
    33. 11.33

      Malaysia

      • Market Size
      • Production
      • Imports
      • Exports
    34. 11.34

      Israel

      • Market Size
      • Production
      • Imports
      • Exports
    35. 11.35

      Singapore

      • Market Size
      • Production
      • Imports
      • Exports
    36. 11.36

      Egypt

      • Market Size
      • Production
      • Imports
      • Exports
    37. 11.37

      Philippines

      • Market Size
      • Production
      • Imports
      • Exports
    38. 11.38

      Finland

      • Market Size
      • Production
      • Imports
      • Exports
    39. 11.39

      Chile

      • Market Size
      • Production
      • Imports
      • Exports
    40. 11.40

      Ireland

      • Market Size
      • Production
      • Imports
      • Exports
    41. 11.41

      Pakistan

      • Market Size
      • Production
      • Imports
      • Exports
    42. 11.42

      Greece

      • Market Size
      • Production
      • Imports
      • Exports
    43. 11.43

      Portugal

      • Market Size
      • Production
      • Imports
      • Exports
    44. 11.44

      Kazakhstan

      • Market Size
      • Production
      • Imports
      • Exports
    45. 11.45

      Algeria

      • Market Size
      • Production
      • Imports
      • Exports
    46. 11.46

      Czech Republic

      • Market Size
      • Production
      • Imports
      • Exports
    47. 11.47

      Qatar

      • Market Size
      • Production
      • Imports
      • Exports
    48. 11.48

      Peru

      • Market Size
      • Production
      • Imports
      • Exports
    49. 11.49

      Romania

      • Market Size
      • Production
      • Imports
      • Exports
    50. 11.50

      Vietnam

      • Market Size
      • Production
      • Imports
      • Exports
  12. LIST OF TABLES

    1. Key Findings In 2025
    2. Market Volume, In Physical Terms: Historical Data (2012–2025) and Forecast (2026–2035)
    3. Market Value: Historical Data (2012–2025) and Forecast (2026–2035)
    4. Per Capita Consumption, by Country, 2022–2025
    5. Production, In Physical Terms, By Country: Historical Data (2012–2025) and Forecast (2026–2035)
    6. Imports, In Physical Terms, By Country: Historical Data (2012–2025) and Forecast (2026–2035)
    7. Imports, In Value Terms, By Country: Historical Data (2012–2025) and Forecast (2026–2035)
    8. Import Prices, By Country: Historical Data (2012–2025) and Forecast (2026–2035)
    9. Exports, In Physical Terms, By Country: Historical Data (2012–2025) and Forecast (2026–2035)
    10. Exports, In Value Terms, By Country: Historical Data (2012–2025) and Forecast (2026–2035)
    11. Export Prices, By Country: Historical Data (2012–2025) and Forecast (2026–2035)
  13. LIST OF FIGURES

    1. Market Volume, In Physical Terms: Historical Data (2012–2025) and Forecast (2026–2035)
    2. Market Value: Historical Data (2012–2025) and Forecast (2026–2035)
    3. Consumption, by Country, 2025
    4. Market Volume Forecast to 2035
    5. Market Value Forecast to 2035
    6. Market Size and Growth, By Product
    7. Average Per Capita Consumption, By Product
    8. Exports and Growth, By Product
    9. Export Prices and Growth, By Product
    10. Production Volume and Growth
    11. Exports and Growth
    12. Export Prices and Growth
    13. Market Size and Growth
    14. Per Capita Consumption
    15. Imports and Growth
    16. Import Prices
    17. Production, In Physical Terms: Historical Data (2012–2025) and Forecast (2026–2035)
    18. Production, In Value Terms: Historical Data (2012–2025) and Forecast (2026–2035)
    19. Production, by Country, 2025
    20. Production, In Physical Terms, by Country: Historical Data (2012–2025) and Forecast (2026–2035)
    21. Imports, In Physical Terms: Historical Data (2012–2025) and Forecast (2026–2035)
    22. Imports, In Value Terms: Historical Data (2012–2025) and Forecast (2026–2035)
    23. Imports, In Physical Terms, By Country, 2025
    24. Imports, In Physical Terms, By Country: Historical Data (2012–2025) and Forecast (2026–2035)
    25. Imports, In Value Terms, By Country: Historical Data (2012–2025) and Forecast (2026–2035)
    26. Import Prices, By Country: Historical Data (2012–2025) and Forecast (2026–2035)
    27. Exports, In Physical Terms: Historical Data (2012–2025) and Forecast (2026–2035)
    28. Exports, In Value Terms: Historical Data (2012–2025) and Forecast (2026–2035)
    29. Exports, In Physical Terms, By Country, 2025
    30. Exports, In Physical Terms, By Country: Historical Data (2012–2025) and Forecast (2026–2035)
    31. Exports, In Value Terms, By Country: Historical Data (2012–2025) and Forecast (2026–2035)
    32. Export Prices, By Country: Historical Data (2012–2025) and Forecast (2026–2035)

Free Training

Source link

Canadian Solar Resets Focus On U.S. Manufacturing And Margin Quality


  • Canadian Solar (NasdaqGS: CSIQ) has appointed Colin Parkin as CEO, with founder Shawn Qu shifting to Executive Chairman and CTO.
  • The company is reorienting its business toward value driven growth and profitability instead of pure volume expansion.
  • Canadian Solar has begun trial production at its new HJT solar cell factory in Indiana and expanded module capacity in Texas to build out its U.S. manufacturing base.

For you as an investor, this marks a key moment for one of the largest solar and storage players, as Canadian Solar (NasdaqGS: CSIQ) refocuses on higher value markets and products. The move into U.S. manufacturing comes as policy support, supply chain concerns, and local content requirements shape how solar capacity is built and sourced.

The leadership change and U.S. build out indicate where management wants the business to be positioned in the coming years, with more emphasis on technology and margin quality. How effectively the company executes on these priorities, and manages the costs of new factories, will likely be central to how the stock is viewed by investors over time.

Stay updated on the most important news stories for Canadian Solar by adding it to your watchlist or portfolio. Alternatively, explore our Community to discover new perspectives on Canadian Solar.

NasdaqGS:CSIQ 1-Year Stock Price ChartNasdaqGS:CSIQ 1-Year Stock Price Chart

Does the team leading Canadian Solar have what it takes? See our full breakdown of the management team’s track record and compensation.

Investor Checklist

Quick Assessment

  • ⚖️ Price vs Analyst Target: The US$17.88 share price sits very close to the US$18.20 analyst target, suggesting limited implied upside from consensus right now.
  • ✅ Simply Wall St Valuation: Shares are described as trading about 53% below estimated fair value, which flags a potential valuation gap to investigate.
  • ✅ Recent Momentum: The stock is up 37.8% over the last 30 days, showing strong short term interest ahead of the leadership transition and U.S. manufacturing push.

There is only one way to know the right time to buy, sell or hold Canadian Solar. Head to Simply Wall St’s
company report for the latest analysis of Canadian Solar’s Fair Value.

Key Considerations

  • 📊 The shift toward higher value markets and U.S. manufacturing focuses attention on margins and product mix rather than pure shipment growth.
  • 📊 Watch how factory ramp up costs, U.S. policy incentives, and any updates to earnings forecasts line up with the current valuation discount and recent price move.
  • ⚠️ One flagged major risk is that interest payments are not well covered by earnings, so it is important to consider this capex heavy push alongside the balance sheet.

Dig Deeper

For the full picture including more risks and rewards, check out the
complete Canadian Solar analysis. Alternatively, you can check out the
community page for Canadian Solar to see how other investors believe this latest news will impact the company’s narrative.

This article by Simply Wall St is general in nature. We provide commentary based on historical data
and analyst forecasts only using an unbiased methodology and our articles are not intended to be financial advice.
It does not constitute a recommendation to buy or sell any stock, and does not take account of your objectives, or your
financial situation. We aim to bring you long-term focused analysis driven by fundamental data.
Note that our analysis may not factor in the latest price-sensitive company announcements or qualitative material.
Simply Wall St has no position in any stocks mentioned.

New: AI Stock Screener & Alerts

Our new AI Stock Screener scans the market every day to uncover opportunities.

• Dividend Powerhouses (3%+ Yield)
• Undervalued Small Caps with Insider Buying
• High growth Tech and AI Companies

Or build your own from over 50 metrics.

Explore Now for Free

Have feedback on this article? Concerned about the content? Get in touch with us directly. Alternatively, email editorial-team@simplywallst.com

Free Training

Source link