Novartis Finalizes $23 Billion U.S. Investment Plan with Seventh New Manufacturing Facility


Novartis has reached the final milestone of its $23 billion domestic investment strategy, announcing a seventh new facility in Morrisville, North Carolina. The 56,200-square-foot plant will focus on active pharmaceutical ingredient (API) manufacturing for solid dosage forms and RNA therapeutics. This addition completes a one-year expansion cycle aimed at establishing a fully autonomous, end-to-end supply chain within the United States. By localized production, the Swiss drugmaker seeks to insulate its American patient base from global logistics volatility and potential pharmaceutical import tariffs.

The expansion marks the first time in Novartis’ history that all its advanced technology platforms—including radioligand, cell and gene therapies, and small molecules—will be manufactured domestically. Over the past 12 months, the firm has broken ground on research centers in San Diego and flagship hubs in the Research Triangle, while also building a coast-to-coast radioligand therapy (RLT) network with new sites in Texas, Florida, and California. CEO Vas Narasimhan noted that the connected footprint allows the firm to “locally develop, produce, and deliver medicines at scale.”This surge in infrastructure is designed to provide “timely access to innovation for patients in the U.S.”

Since launching the initiative in April 2025, Novartis has committed to manufacturing all its key medicines for U.S. patients within the country. The Morrisville site specifically complements existing North Carolina facilities focused on biologics and sterile packaging, creating a regional hub for oncology, immunology, and cardiovascular treatments. This infrastructure push coincides with a broader industry shift toward regionalized manufacturing as a hedge against geopolitical uncertainty. As the company nears full operational status for its new sites, it remains on track to integrate discovery and production more tightly than ever before across its 10-site U.S. network.

Read more

Free Training

Source link

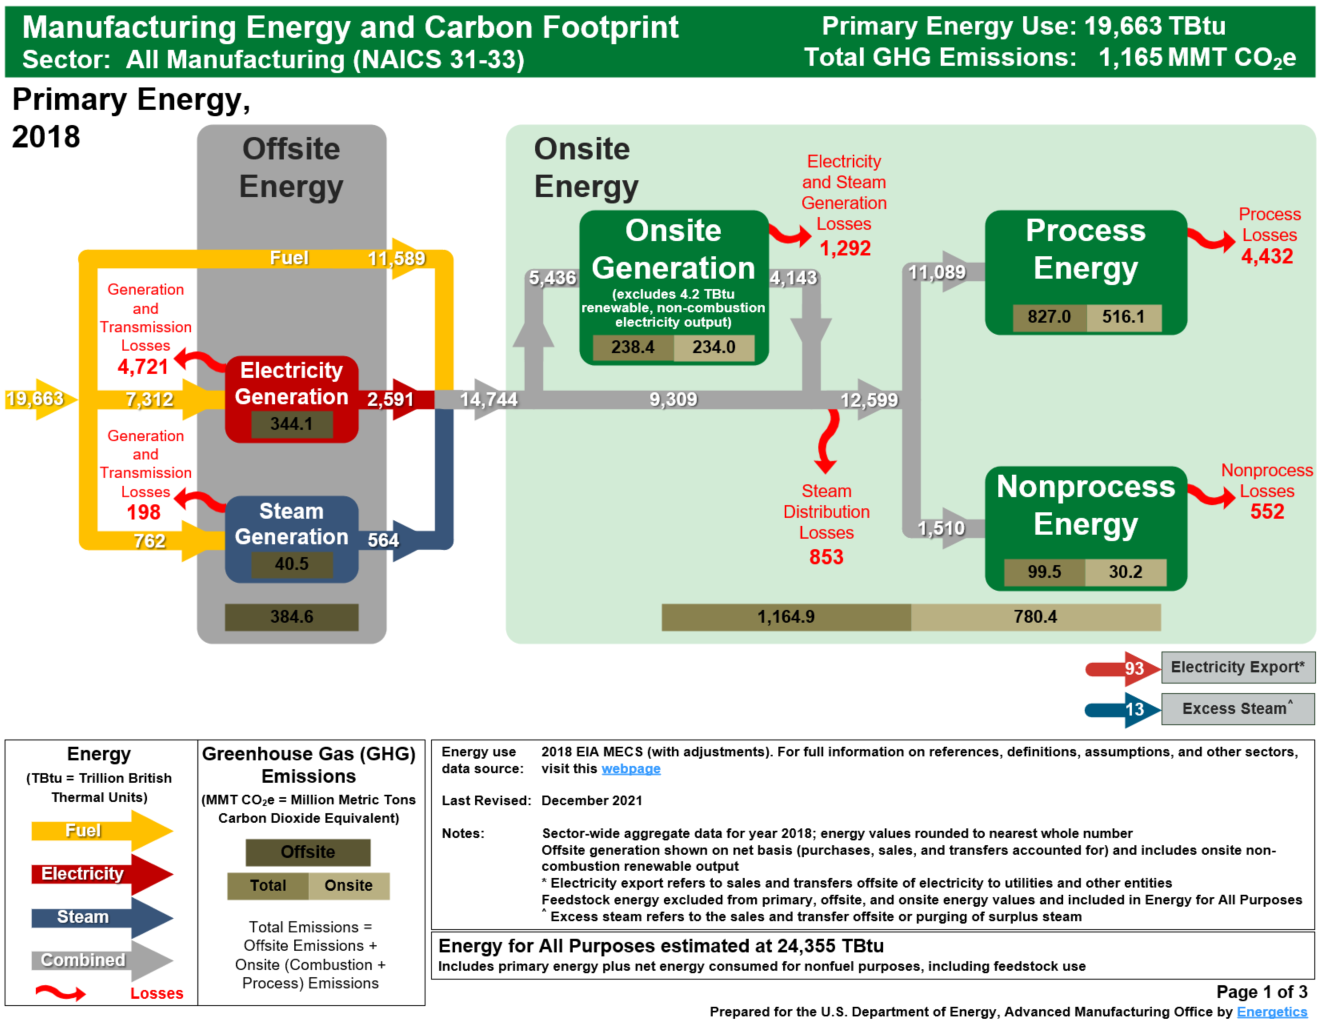
Manufacturing Energy and Carbon Footprints (2018 MECS)


Note: This page was published in December 2021 with the most recent Manufacturing Energy and Carbon Footprints, using 2018 U.S. Energy Information Administration (EIA) Manufacturing Energy Consumption Survey (MECS) data and updated assumptions. Earlier versions of the footprints are still available: 2014 EIA MECS data footprints, 2010 EIA MECS data footprints, and 2006 EIA MECS data footprints. Detailed analysis of the footprints and sector rankings, utilizing 2006 data, is available in the U.S. Manufacturing Energy Use and Greenhouse Gas Emissions Analysis report. For more information, reach out to us.

Manufacturing Energy and Carbon Footprints map the flow of energy supply, demand, and losses as well as greenhouse gas (GHG) emissions in diverse U.S. manufacturing industries, based on EIA MECS and U.S. Environmental Protection Agency (EPA) emissions data.

The footprints show where energy is used and lost in manufacturing—and the associated combustion and process greenhouse gas (GHG) emissions. Each footprint visualizes the flow of energy (in the form of fuel, electricity, or steam) to major end uses in manufacturing, including boilers, combined heat and power generation, process heaters, process coolers, machine-driven equipment, facility HVAC. The GHG emissions associated with energy generation and end use are also mapped.

AVAILABLE 2018 DATA FOOTPRINTS

Footprints are available for 15 manufacturing sectors, that collectively represent 95% of U.S. manufacturing primary energy use, 5 manufacturing subsectors, and U.S. manufacturing as a whole in 2018. Each of the 21 footprints are accessible through the links below. To download all footprints, click here.

FOOTPRINT CONTENT

The footprints present data at three levels of detail. The first page provides a high-level view of primary energy for heat and power (offsite and onsite), while the second page shows details of how energy is distributed to onsite end uses. The third page depicts the GHG emissions from each point of energy generation, end use, and non-combustion sources (i.e., industrial process emissions). The analyses are based on manufacturing energy consumption data from EIA’s Manufacturing Energy Consumption Survey (MECS), along with referenced energy loss and emission factors, and input from industry and subject matter experts. Greenhouse gas emissions analysis combines data from MECS as well as EPA’s Inventory of U.S. Greenhouse Gas Emissions and Sinks.

Aggregate data provided in each of the sectors includes:

  • Electricity and steam generated offsite and transferred to the facility
  • Electricity and steam generated onsite
  • Fuel, electricity, and steam consumed by major end uses in a manufacturing facility
  • Offsite and onsite energy losses due to the generation, transmission and distribution, and end use consumption of energy (some losses are unrecoverable)
  • Greenhouse gas emissions emitted during fuel combustion and byproducts of various non-energy-related manufacturing processes

FOOTPRINT PURPOSE

Footprints can help users better understand the distribution of energy use and compare use, loss, and GHG emissions within and across U.S. manufacturing sectors. Areas of significant energy consumption, energy losses, and/or GHG emissions could indicate improvement opportunities by implementing energy management best practices, upgrading energy systems, or developing new technologies. The footprints provide a macro-scale benchmark for evaluating energy and GHG emissions and for prioritizing opportunity analysis.

ADDITIONAL ANALYSIS

The U.S. Manufacturing Energy Use and Greenhouse Gas Emissions Analysis report expands on the Energy and Carbon Footprints for 2006 to trace energy from supply (fuel, electricity, and steam) to major end-use applications in U.S. manufacturing. The report ranks the energy use, energy losses, and greenhouse gas (GHG) combustion emissions of 15 sectors.

Free Training

Source link

Japanese Yen falls amid strong US Manufacturing PMI


The USD/JPY pair rose toward the 159.30 price zone, closing in on the 160.00 level, which usually prompts intervention by the Bank of Japan (BoJ).

The latest S&P Global flash Purchasing Managers Index (PMI) data showed the US Composite PMI held steady at 51.7 in May, matching April’s reading and signaling continued economic expansion. Manufacturing activity improved further, with the Manufacturing PMI rising to 55.3 from 54.5, surpassing market expectations of 54.0. Meanwhile, the Services PMI eased slightly to 50.9 from 51.0, highlighting softer momentum in the service sector.

According to S&P Global, “business activity continued to grow in May but at a reduced rate compared to that seen earlier in the year,” while the report also noted that service sector growth remains sluggish amid only modest improvements in new business inflows. The stronger manufacturing figures helped support the Greenback as traders reassessed expectations for Federal Reserve (Fed) rate cuts.

US Treasury Secretary Scott Bessent stated that the United States and Japan agree that excessive volatility in currency markets is undesirable, comments interpreted as indirect support for Tokyo’s recent intervention efforts to stabilize the Yen. Bessent also expressed confidence that Bank of Japan (BoJ) Governor Kazuo Ueda will successfully guide monetary policy and avoid falling behind inflation pressure.

Chart Analysis USD/JPY

USD/JPY technical analysis:

On the 4-hour chart, USD/JPY trades at 159.19. The pair retains a bullish near-term bias as price holds above both the 20-period Simple Moving Average (SMA) around 158.99 and the 100-period SMA near 157.82, keeping the broader uptrend structure intact. The horizontal line drawn at 159.19 is being tested as a pivot area, while the Relative Strength Index (RSI) eases back toward 68, hinting that upside momentum remains constructive but is edging closer to overbought territory, which could slow the pace of further gains.

On the topside, immediate resistance is seen at the 159.19 pivot area, followed by the horizontal barrier at 159.35, where a clear break would open the way to fresh highs in the near term. On the downside, initial support is located at 159.09, ahead of the 20-period SMA and the horizontal level at 158.90, with the 100-period SMA providing a deeper dynamic floor if a corrective pullback extends.

(The technical analysis of this story was written with the help of an AI tool.)

Free Training

Source link