US Manufacturing Boom Favors 167 High-Conviction Hubs


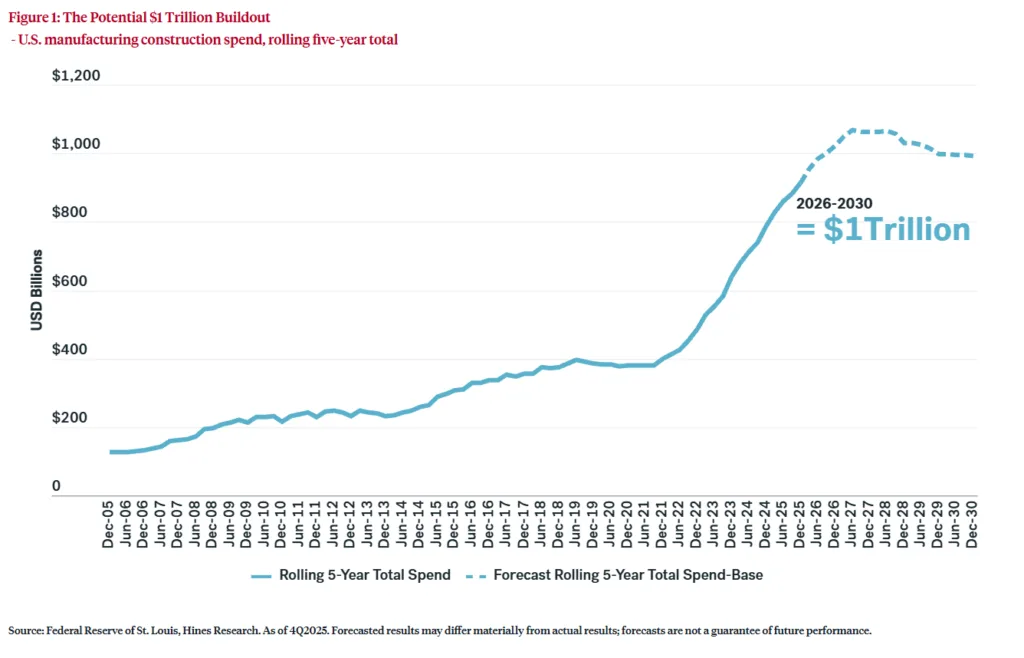
  • US manufacturing construction spending may reach $1 trillion from 2026–2030, with growth concentrated in select industrial submarkets.
  • Advanced manufacturing and ‘New Companies Doing New Things’ are driving leasing demand in regional hubs such as Dallas–Fort Worth, Houston, Phoenix, Atlanta, Chicago, and San Jose.
  • A Hines study identified just 167 ‘high-conviction’ submarkets out of 1,500 nationwide as best positioned to convert manufacturing investment into sustained rent and demand growth.

Key Takeaways

Rise of the Advanced Manufacturing Ecosystem

The US manufacturing surge is sharpening investor focus on a small group of emerging and established industrial hubs. According to Hines Research, manufacturing construction spending could reach roughly $1 trillion between 2026 and 2030. Cyclical rebounds will contribute, alongside a structural shift toward advanced manufacturing.

Hines analyzed about 1,500 submarkets and found that outperformance remains highly concentrated. Winning markets have deep industrial ecosystems or supply constraints that strengthen tenant demand and rent growth. Wholesale reshoring remains limited, but federal incentives and supply chain resilience continue driving capital into US manufacturing. These forces reinforce regional clusters and attract industrial occupiers seeking capacity for next-generation production.

US manufacturing construction spending is projected to reach a rolling five-year total of roughly $1 trillion from 2026 through 2030.

The Details

Hines Research applied its proprietary Manufacturing Market Growth Score (MMGS) across submarkets in 75 US metros. The score weighs manufacturing stock at 48% and five-year manufacturing employment growth at 47%. Current manufacturing workforce size accounts for the remaining 5%. Only 167 submarkets, or roughly 12%, scored above 70, highlighting concentrated investment opportunities.

Dallas–Fort Worth leads as a logistics and defense hub, while Houston stands out in energy and petrochemicals. Phoenix and San Jose excel in semiconductors. Data centers also attract logistics companies and advanced component providers, despite falling outside traditional manufacturing. Meanwhile, battery hubs stretch from the Great Lakes through Tennessee and the Southeast. Many overlap with Opportunity Zones, adding another consideration for tax-sensitive capital.
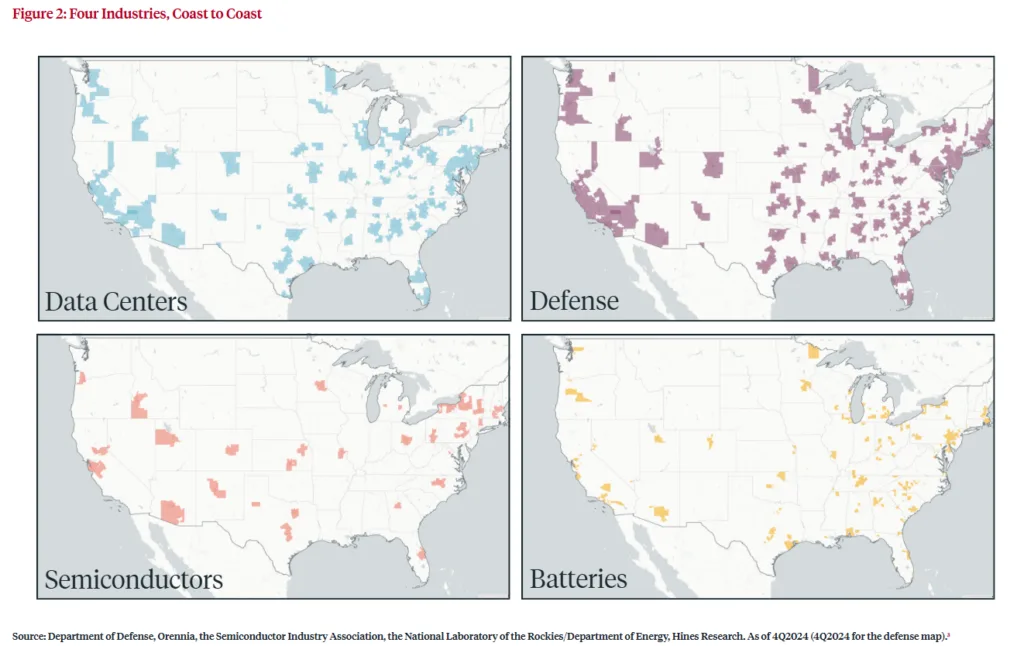
US map showing geographic clusters for data centers, defense, semiconductor, and battery industries across major manufacturing markets.

Concentration, Not Uniformity, Defines Growth

Despite the $1 trillion forecast, Hines found that capital and tenant demand remain tightly clustered. Of 167 high-conviction submarkets, 162 have significant defense and data center footprints. Those sectors now function as industrial table stakes rather than meaningful differentiators. Semiconductor and battery clusters remain more selective. Battery activity concentrates across 54 submarkets that also qualify as Opportunity Zones.

Spillover activity is emerging along the Great Lakes-Tennessee corridor and in upstate New York, Tulsa, and New Mexico. These markets offer lower-cost alternatives for manufacturers seeking available land and power outside highly competitive metros. Recent shifts in Austin battery facility plans also show how quickly manufacturers can adjust investment and production strategies. Data centers follow different site-selection patterns, favoring power-rich markets like West Texas and Iowa. That trend creates parallel industrial demand across regions with limited historical manufacturing density.
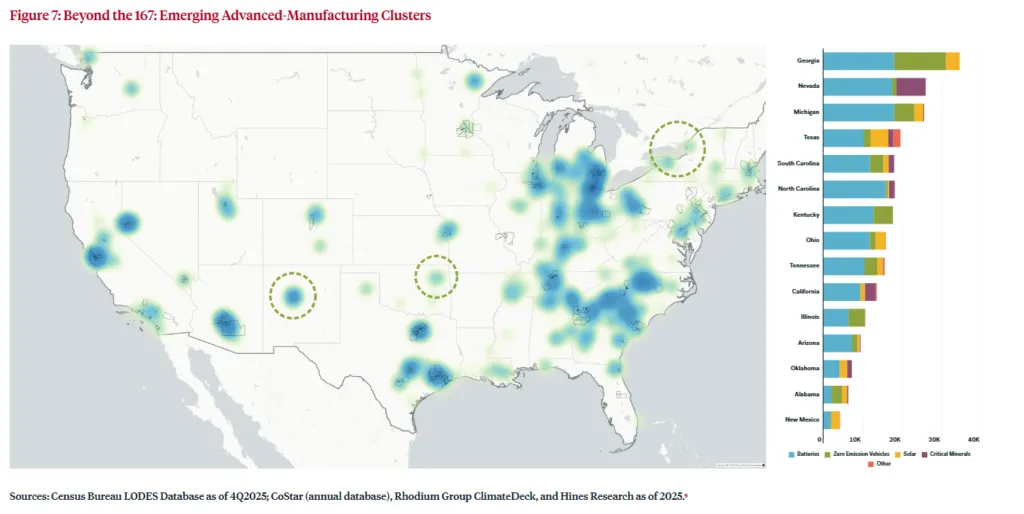
US map showing emerging advanced manufacturing clusters, with battery-related employment concentrated across the Southeast, Midwest, and selected Western markets.

Why It Matters

Investors must determine which markets can translate manufacturing investment into durable rent and demand growth. Hines analyzed Census Bureau and CoStar data through 2025 to measure historical performance. Top-scoring submarkets recorded stronger five-year rent growth and occupied SF gains than lower-scoring peers. The demand gap proved especially significant. Highest-scoring markets gained occupied space, while the bottom quartile recorded net declines.

Institutional capital can gain more by targeting established ecosystems than broadly chasing the manufacturing boom. Scale, infrastructure, and supply chain depth create a virtuous cycle that supports additional investment. Supply constraints can amplify rent growth in tight clusters. New industrial nodes offer potential upside but carry greater oversupply risk. Opportunity Zones can further improve risk-adjusted returns for tax-sensitive investors near battery and semiconductor clusters.

The advanced manufacturing buildout also changes CRE demand fundamentals. Companies and government entities increasingly prioritize supply chain resilience alongside operating efficiency. Large projects can create self-reinforcing hubs of investment, skilled labor, and supplier networks. This agglomeration effect expands demand beyond manufacturers to logistics, infrastructure, and component businesses. In turn, those supporting industries strengthen the competitive advantages of leading submarkets.

What’s Next

Federal policy and private capital could sustain the manufacturing expansion and intensify investor focus on Hines’ 167 high-conviction submarkets. Developers will likely pursue emerging corridors with affordable land and sufficient grid capacity. Areas near new data centers and battery plants could attract particularly strong interest.

However, investors must carefully manage exposure in tertiary markets. Rapid construction could outpace tenant absorption and weaken rent growth. The strongest markets will combine supply constraints, established industrial ecosystems, and infrastructure capable of supporting additional investment. Those fundamentals offer the clearest path for converting the $1 trillion manufacturing boom into durable CRE returns.

Free Training

Source link

Edge Aerospace expands U.S. manufacturing through licensing pact with Redwire


SALT LAKE CITY – Redwire will manufacture data processing units and network switches under a licensing agreement with Luxembourg-based Edge Aerospace, the companies announced Aug. 25 at the Small Satellite Conference.

“This agreement represents an important step in our long-term strategy to make advanced space computing more accessible to customers in the United States,” Edge Aerospace CEO Jarosław Jaworski said in the news release. “Redwire has earned a reputation as one of the industry’s most trusted providers of flight-proven space infrastructure. By combining Edge’s high-performance computing technology with Redwire’s manufacturing expertise and customer reach, we can deliver domestically manufactured computing systems that meet the growing demand for intelligent spacecraft capable of processing more data at the edge.”

Through the agreement, Edge Aerospace seeks to accelerate delivery of space-qualified computing products while increasing supply chain resilience and broadening support for its growing U.S. customer base, according to the news release.

“Redwire is proud to leverage our trusted domestic manufacturing expertise and strong customer base to support Edge Aerospace,” Don Wesson, Redwire senior vice president for defense technology and general manager of Redwire’s Marlborough, Massachusetts, facility. “Redwire is committed to manufacturing and delivering reliable, American-made, flight-qualified technology to customers who need mission-ready capabilities.”

Debra Werner is a correspondent for SpaceNews based in San Francisco.

Debra earned a bachelor’s degree in communications from the University of California, Berkeley, and a master’s degree in Journalism from Northwestern University. She is a recipient…

Free Training

Source link

Vicente Torns announces first U.S. manufacturing facility – Peak of Ohio


A major economic development announcement has been made in West Liberty after months of work at the local and state levels.

Spanish manufacturer Vicente Torns has announced plans to establish its first U.S. operation in Logan County, bringing new investment and job opportunities to the community.

The project is also receiving support from the state through a Job Creation Tax Credit.

Vicente Torns is among 13 projects approved by the Ohio Tax Credit Authority, with the statewide projects expected to create more than 3,500 new jobs and bring more than $1.1 billion in investment.

The company is expected to create 108 full-time jobs, generating more than $7.1 million in new annual payroll by the end of 2030.

Vicente Torns is a third-generation, family-owned company with more than 100 years of operating history.

The company manufactures copper and aluminum cables and wires used in the energy, automotive, and transportation industries.

As part of the project, Vicente Torns plans to acquire an existing building in West Liberty, renovate and expand it, and add new equipment.

The expansion will allow the company to manufacture conductors used in electric transformers.

The Ohio Tax Credit Authority approved a 1.427-percent, eight-year Job Creation Tax Credit for the project.

Governor Mike DeWine, Lieutenant Governor Jim Tressel and Ohio Department of Development Director Lydia Mihalik announced the approvals Monday.

Statewide, the 13 projects are expected to create 3,553 new jobs, retain another 907 jobs, and generate nearly $310 million in new payroll.

The projects span several industries, including manufacturing, aerospace, defense, technology, and engineering.

Here are the details in the official announcement:

“Vicente Torns Ohio Corp., an international manufacturer of copper and aluminum cables and wires, will establish its first U.S. manufacturing facility in West Liberty. The company will invest $21 million at 600 N. Detroit St. and create 108 new jobs representing $7.1 million in new annual payroll.

The West Liberty operation will produce copper and aluminum wires used in electric transformers. The project will establish a U.S. manufacturing base for Vicente Torns as the company expands its presence in North America and serves growing demand from the energy industry.

“Establishing our first manufacturing operation in the United States marks an important step in the continued growth of Vicente Torns. Within four years, we expect the U.S. market to account for 15 percent of the group’s total revenue,” said Vicente Torns, CEO of Vicente Torns. “West Liberty provides a strong foundation to serve our customers, build a skilled local workforce and expand our production capabilities in North America. We appreciate the partnership and support that helped bring this investment to the Columbus Region.”

With more than 100 years of manufacturing experience, Vicente Torns operates facilities in Spain, Slovakia, Italy, Morocco, India and France. The company serves customers across different sectors, especially is energy, particularly transformers, high-voltage motors, and generators, and, to a lesser extent, electric vehicles and railways.

“Vicente Torns’ decision to establish its first U.S. manufacturing facility in West Liberty is a major vote of confidence in our community and our workforce,” said West Liberty Mayor Brad Hudson. “This investment will create more than 100 jobs and bring a respected international manufacturer with more than a century of experience to Logan County. We look forward to supporting the company’s success here.”

Pending local approval, the project represents a significant foreign direct investment in the Columbus Region and adds to the Region’s growing base of international manufacturers. Vicente Torns’ selection of West Liberty also creates new manufacturing capacity supporting equipment essential to the nation’s electric infrastructure.

“The Columbus Region has become a strong entry point for global manufacturers establishing U.S. operations,” said Jonas Peterson, chief economic development officer and president of One Columbus. “Our central location provides efficient access to major North American markets. Our manufacturing base connects companies with experienced workers and established industrial partners. Communities such as West Liberty offer the capacity and support needed for long-term growth. Vicente Torns’ decision reflects the strength of that regional proposition.”

Vicente Torns selected Logan County for its first U.S. manufacturing operation as rising energy demand drives greater need for the copper and aluminum wire used in electric transformers. The decision reflects the strength of the area’s manufacturing workforce and the Columbus Region’s strategic access to customers across North America.

“Ohio continues to win global manufacturers because we deliver what they actually need: access to customers, resilient supply chains, and the ability to scale fast from the center of the North American market,” said JobsOhio President and CEO J.P. Nauseef. “Vicente Torns’ investment is proof our strategy to attract global companies critical to the nation’s energy infrastructure is working.”

Free Training

Source link

Secretary of War Pete Hegseth Visits Oshkosh Corporation, Highlighting the Strength of American Manufacturing and the Arsenal of Freedom | News


State

AlabamaAlaskaArizonaArkansasCaliforniaColoradoConnecticutDelawareFloridaGeorgiaHawaiiIdahoIllinoisIndianaIowaKansasKentuckyLouisianaMaineMarylandMassachusettsMichiganMinnesotaMississippiMissouriMontanaNebraskaNevadaNew HampshireNew JerseyNew MexicoNew YorkNorth CarolinaNorth DakotaOhioOklahomaOregonPennsylvaniaRhode IslandSouth CarolinaSouth DakotaTennesseeTexasUtahVermontVirginiaWashingtonWashington D.C.West VirginiaWisconsinWyomingPuerto RicoUS Virgin IslandsArmed Forces AmericasArmed Forces PacificArmed Forces EuropeNorthern Mariana IslandsMarshall IslandsAmerican SamoaFederated States of MicronesiaGuamPalauAlberta, CanadaBritish Columbia, CanadaManitoba, CanadaNew Brunswick, CanadaNewfoundland, CanadaNova Scotia, CanadaNorthwest Territories, CanadaNunavut, CanadaOntario, CanadaPrince Edward Island, CanadaQuebec, CanadaSaskatchewan, CanadaYukon Territory, Canada

Zip Code

Country

United States of AmericaUS Virgin IslandsUnited States Minor Outlying IslandsCanadaMexico, United Mexican StatesBahamas, Commonwealth of theCuba, Republic ofDominican RepublicHaiti, Republic ofJamaicaAfghanistanAlbania, People’s Socialist Republic ofAlgeria, People’s Democratic Republic ofAmerican SamoaAndorra, Principality ofAngola, Republic ofAnguillaAntarctica (the territory South of 60 deg S)Antigua and BarbudaArgentina, Argentine RepublicArmeniaArubaAustralia, Commonwealth ofAustria, Republic ofAzerbaijan, Republic ofBahrain, Kingdom ofBangladesh, People’s Republic ofBarbadosBelarusBelgium, Kingdom ofBelizeBenin, People’s Republic ofBermudaBhutan, Kingdom ofBolivia, Republic ofBosnia and HerzegovinaBotswana, Republic ofBouvet Island (Bouvetoya)Brazil, Federative Republic ofBritish Indian Ocean Territory (Chagos Archipelago)British Virgin IslandsBrunei DarussalamBulgaria, People’s Republic ofBurkina FasoBurundi, Republic ofCambodia, Kingdom ofCameroon, United Republic ofCape Verde, Republic ofCayman IslandsCentral African RepublicChad, Republic ofChile, Republic ofChina, People’s Republic ofChristmas IslandCocos (Keeling) IslandsColombia, Republic ofComoros, Union of theCongo, Democratic Republic ofCongo, People’s Republic ofCook IslandsCosta Rica, Republic ofCote D’Ivoire, Ivory Coast, Republic of theCyprus, Republic ofCzech RepublicDenmark, Kingdom ofDjibouti, Republic ofDominica, Commonwealth ofEcuador, Republic ofEgypt, Arab Republic ofEl Salvador, Republic ofEquatorial Guinea, Republic ofEritreaEstoniaEthiopiaFaeroe IslandsFalkland Islands (Malvinas)Fiji, Republic of the Fiji IslandsFinland, Republic ofFrance, French RepublicFrench GuianaFrench PolynesiaFrench Southern TerritoriesGabon, Gabonese RepublicGambia, Republic of theGeorgiaGermanyGhana, Republic ofGibraltarGreece, Hellenic RepublicGreenlandGrenadaGuadaloupeGuamGuatemala, Republic ofGuinea, Revolutionary
People’s Rep’c ofGuinea-Bissau, Republic ofGuyana, Republic ofHeard and McDonald IslandsHoly See (Vatican City State)Honduras, Republic ofHong Kong, Special Administrative Region of ChinaHrvatska (Croatia)Hungary, Hungarian People’s RepublicIceland, Republic ofIndia, Republic ofIndonesia, Republic ofIran, Islamic Republic ofIraq, Republic ofIrelandIsrael, State ofItaly, Italian RepublicJapanJordan, Hashemite Kingdom ofKazakhstan, Republic ofKenya, Republic ofKiribati, Republic ofKorea, Democratic People’s Republic ofKorea, Republic ofKuwait, State ofKyrgyz RepublicLao People’s Democratic RepublicLatviaLebanon, Lebanese RepublicLesotho, Kingdom ofLiberia, Republic ofLibyan Arab JamahiriyaLiechtenstein, Principality ofLithuaniaLuxembourg, Grand Duchy ofMacao, Special Administrative Region of ChinaMacedonia, the former Yugoslav Republic ofMadagascar, Republic ofMalawi, Republic ofMalaysiaMaldives, Republic ofMali, Republic ofMalta, Republic ofMarshall IslandsMartiniqueMauritania, Islamic Republic ofMauritiusMayotteMicronesia, Federated States ofMoldova, Republic ofMonaco, Principality ofMongolia, Mongolian People’s RepublicMontserratMorocco, Kingdom ofMozambique, People’s Republic ofMyanmarNamibiaNauru, Republic ofNepal, Kingdom ofNetherlands AntillesNetherlands, Kingdom of theNew CaledoniaNew ZealandNicaragua, Republic ofNiger, Republic of theNigeria, Federal Republic ofNiue, Republic ofNorfolk IslandNorthern Mariana IslandsNorway, Kingdom ofOman, Sultanate ofPakistan, Islamic Republic ofPalauPalestinian Territory, OccupiedPanama, Republic ofPapua New GuineaParaguay, Republic ofPeru, Republic ofPhilippines, Republic of thePitcairn IslandPoland, Polish People’s RepublicPortugal, Portuguese RepublicPuerto RicoQatar, State ofReunionRomania, Socialist Republic ofRussian FederationRwanda, Rwandese RepublicSamoa, Independent State ofSan Marino, Republic ofSao Tome and Principe, Democratic Republic ofSaudi Arabia, Kingdom ofSenegal, Republic ofSerbia and MontenegroSeychelles, Republic ofSierra Leone, Republic ofSingapore, Republic ofSlovakia (Slovak Republic)SloveniaSolomon IslandsSomalia, Somali RepublicSouth Africa, Republic ofSouth Georgia and the South Sandwich IslandsSpain, Spanish StateSri Lanka, Democratic Socialist Republic ofSt. HelenaSt. Kitts and NevisSt. LuciaSt. Pierre and MiquelonSt. Vincent and the GrenadinesSudan, Democratic Republic of theSuriname, Republic ofSvalbard & Jan Mayen IslandsSwaziland, Kingdom ofSweden, Kingdom ofSwitzerland, Swiss ConfederationSyrian Arab RepublicTaiwan, Province of ChinaTajikistanTanzania, United Republic ofThailand, Kingdom ofTimor-Leste, Democratic Republic ofTogo, Togolese RepublicTokelau (Tokelau Islands)Tonga, Kingdom ofTrinidad and Tobago, Republic ofTunisia, Republic ofTurkey, Republic ofTurkmenistanTurks and Caicos IslandsTuvaluUganda, Republic ofUkraineUnited Arab EmiratesUnited Kingdom of Great Britain & N. IrelandUruguay, Eastern Republic ofUzbekistanVanuatuVenezuela, Bolivarian Republic ofViet Nam, Socialist Republic ofWallis and Futuna IslandsWestern SaharaYemenZambia, Republic ofZimbabwe

Free Training

Source link

Roche Invests $750m to Double US Manufacturing Plant


Roche is far from alone

Roche’s spending sits within a much wider surge of pharmaceutical reshoring across the United States, a trend accelerated by the threat of tariffs on medicines manufactured overseas under President Donald Trump. Rival drugmakers have announced comparably enormous sums in recent months. Novartis has committed $23bn to building or expanding ten US facilities. Johnson & Johnson has pledged $55bn toward domestic manufacturing, including three entirely new sites, while Eli Lilly is midway through a $27bn investment programme covering four additional plants.

Bristol Myers Squibb has made a similar move, unveiling a $2.3bn “multi-modal manufacturing campus” in Houston, Texas, as part of a broader $40bn, five-year plan covering US research, technology and manufacturing. “This investment reflects our confidence in America’s continued leadership in biopharmaceutical innovation,” said BMS Board Chair and CEO Christopher Boerner. “As part of our $40bn commitment to the United States, we’re building the domestic manufacturing capabilities needed to deliver the next generation of medicines and support future scientific breakthroughs. Houston and the state of Texas offer the talent, infrastructure, and partnership needed to help bring that vision to life.”

Free Training

Source link

3 U.S. Manufacturing Stocks Tied To Tariff Driven Onshoring】【。


With a fresh US–Canada trade clash pushing tariffs higher and rattling cross border supply chains, investors face a new map of potential winners and losers. Sudden shifts in costs and sourcing can reshape where production happens and which companies keep pricing power. This article walks through three stocks from our U.S. Onshoring and Domestic Manufacturing Beneficiaries screener that appear well positioned for this moment.

The stocks highlighted below are just a starting sample, and the full screen surfaced 7 more companies with equally detailed domestic manufacturing narratives that are not covered here. If you want to move beyond the short list and start sizing up reshoring beneficiaries for yourself, head straight into the U.S. Onshoring and Domestic Manufacturing Beneficiaries screener to identify, filter and analyze the setups that best fit your own conviction.

SunCoke Energy (SXC)

SunCoke Energy is a coke producer tightly linked to U.S. steelmaking, which puts it squarely in the onshoring and domestic manufacturing story as tariffs push buyers toward tariff-insulated inputs. The business is heavily weighted to Domestic Coke, which generated about US$1.5b of revenue, with Industrial Services adding roughly US$356 million and smaller contributions from Corporate and Other and intersegment eliminations. With a market cap of about US$822 million, SunCoke Energy is a mid-cap stock that gives investors focused exposure to the U.S. steel supply chain rather than a broad metals basket.

For investors looking at how a prolonged US-Canada trade clash could reshape North American steel supply chains, SunCoke Energy offers a direct way to study those shifts. The company supplies coke and logistics services that support domestic blast furnaces, and it has been expanding into industrial services that can help smooth revenue. At the same time, it carries meaningful leverage, relies on a handful of large steel customers and pays a dividend that has raised questions around long term cover. That combination of tariff tailwinds, earnings guidance and balance sheet and customer concentration risk is why this stock may warrant a closer look before deciding where it fits in a portfolio.

SunCoke Energy’s tariff‑shielded position in the U.S. steel chain could be more powerful than the headline story suggests, yet its leverage and customer reliance raise real questions. Get the full picture in the 3 key rewards and 2 important warning signs (2 are major!)

NYSE:SXC Revenue & Expenses Breakdown as at Aug 2026NYSE:SXC Revenue & Expenses Breakdown as at Aug 2026

Build your own tariff beneficiaries shortlist

SunCoke Energy and the two other stocks in this list all came from a single Simply Wall St screener, but the real edge comes when you shape the filters yourself. Use our flexible Screener to mix valuation, growth, balance sheet, risk and dividend filters to suit your style, or tap into our curated Investing Ideas for ready made stock shortlists.

Aebi Schmidt Holding (AEBI)

Aebi Schmidt Holding manufactures specialized vehicles and equipment for airports, municipalities, commercial fleets and agriculture, which fits the onshoring theme through its North American production footprint and focus on workhorse infrastructure gear. The company generates about US$1.4b of revenue from North America and roughly US$576 million from Europe and the rest of the world, giving it meaningful exposure to U.S. demand for domestically produced equipment. With a market cap of about US$956 million, Aebi Schmidt Holding sits in mid cap territory where individual contracts and capacity decisions can materially influence the story.

Investors watching tariff driven reshoring should have Aebi Schmidt Holding on the radar because it brings a large, visible backlog, growing North American operations and a recent beat on Q2 2026 revenue and earnings into a sector where U.S. made fleet and airport equipment may gain share. The company is working through cost inflation and relies on external borrowings, so thin margins and leverage keep execution risk on the table even as management pursues efficiency programs and integration synergies. That mix of potential earnings upside tied to higher utilization and municipal and airport demand, alongside balance sheet and profitability questions, is exactly where deeper research can matter most.

Aebi Schmidt Holding’s backlog and North American footprint could be masking a much bigger earnings story. Get the full context in the 3 key rewards and 2 important warning signs (1 is major!) and see what the latest contracts might really signal

NasdaqGS:AEBI Revenue & Expenses Breakdown as at Aug 2026NasdaqGS:AEBI Revenue & Expenses Breakdown as at Aug 2026

Meritor (MTOR)

Meritor is a long established Michigan based manufacturer of axles, brakes and driveline components for medium and heavy duty trucks, trailers, military vehicles and buses, with growing electric drive systems that tie it directly into the U.S. auto and machinery supply chain story as companies look to source more content domestically. The stock has a market cap of about US$2.6b, which puts it in a bracket where contract wins, product mix and capital allocation decisions can still meaningfully influence long term value for shareholders.

Investors watching the US–Canada trade clash and the push for more U.S. made vehicle content should have Meritor on the radar. The company supplies core hardware that truck and machinery makers struggle to swap out quickly, and it is investing in electric drive systems that align with longer term freight and bus electrification. At the same time, high leverage and limited cash flow cover for debt mean any ramp up in North American production needs to be funded carefully, which keeps execution risk front and center. The balance of improving profitability, potential for a valuation rerating and a balance sheet that demands respect is exactly why a closer look at Meritor could be time well spent.

Meritor’s shift into electric drive systems could be masking a very different earnings path. Scan the 3 key rewards and 1 important major warning sign to see how the balance sheet risk and potential upside really line up.

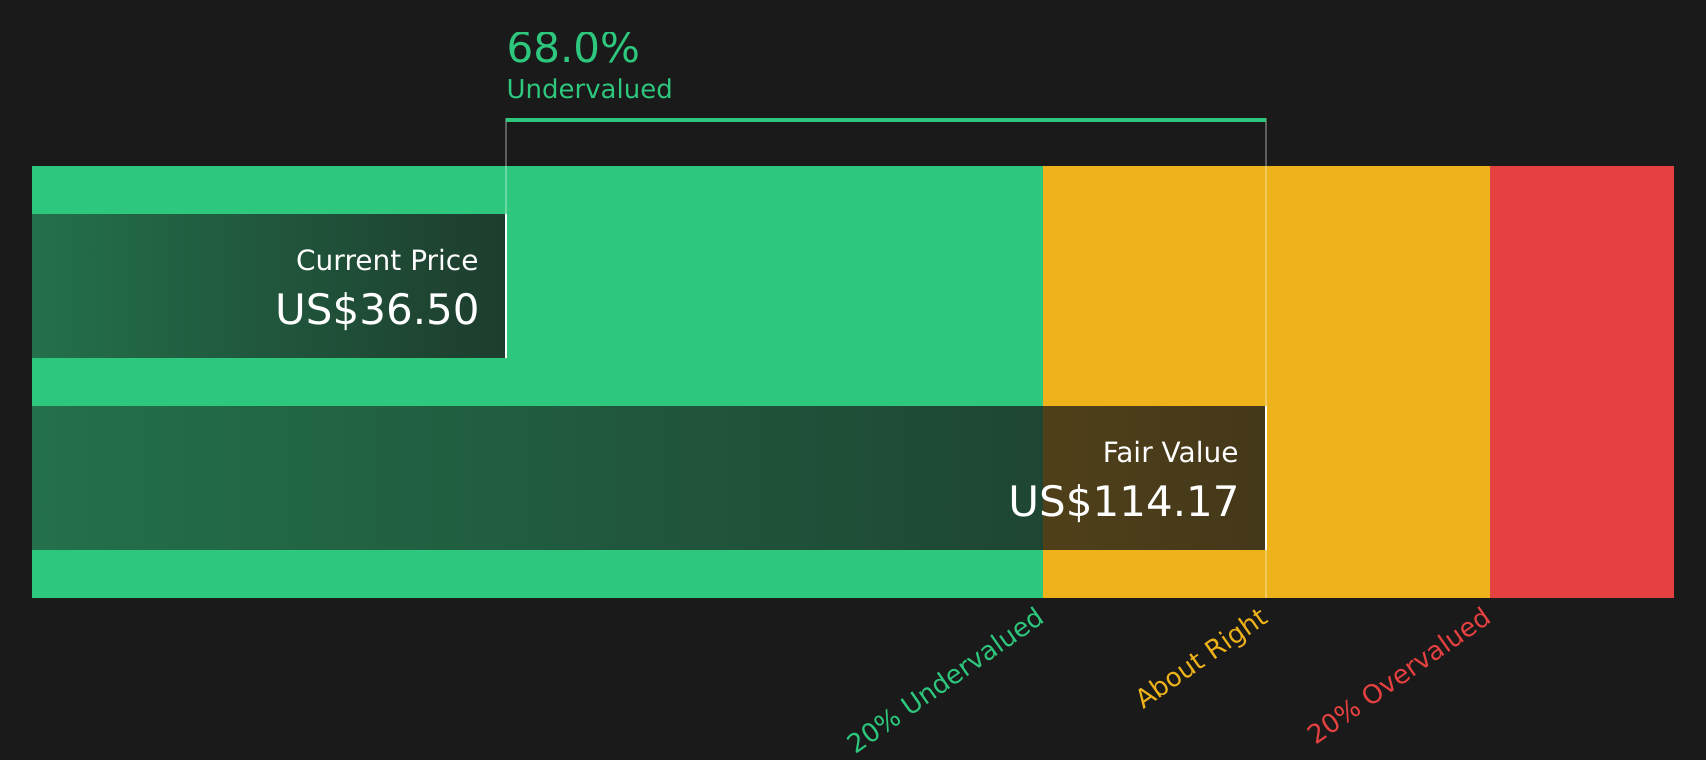
MTOR Discounted Cash Flow as at Aug 2026MTOR Discounted Cash Flow as at Aug 2026

Seeking Curiosity In Fresh Alternatives

Fresh stock ideas can move quickly when momentum builds and pricing gaps close. Consider identifying potential breakouts while they are still under the radar.

This article by Simply Wall St is general in nature. We provide commentary based on historical data
and analyst forecasts only using an unbiased methodology and our articles are not intended to be financial advice.
It does not constitute a recommendation to buy or sell any stock, and does not take account of your objectives, or your
financial situation. We aim to bring you long-term focused analysis driven by fundamental data.
Note that our analysis may not factor in the latest price-sensitive company announcements or qualitative material.
Simply Wall St has no position in any stocks mentioned.

New: Manage All Your Stock Portfolios in One Place

We’ve created the ultimate portfolio companion for stock investors, and it’s free.

• Connect an unlimited number of Portfolios and see your total in one currency
• Be alerted to new Warning Signs or Risks via email or mobile
• Track the Fair Value of your stocks

Try a Demo Portfolio for Free

Have feedback on this article? Concerned about the content? Get in touch with us directly. Alternatively, email editorial-team@simplywallst.com

Free Training

Source link

To win the next war, America must give up consumer goods race against China


As we celebrate America’s 250th birthday, our pride in successfully reaching this milestone must be tempered by the challenge we face: ensuring a strong, secure, and resilient nation for the next 250 years and more. 

There is a clear, albeit difficult, path forward. First, revive, reconstitute, and reconfigure America’s manufacturing base. Second, within the confines of the U.S. sphere of influence (encompassing the homeland and the rest of the Americas), assemble and build critical supply chains with respect to the technology, energy, and food sectors that are vital to our economic and military security. Third, put in place a pragmatic fiscal framework that defuses the huge, ticking federal deficit bomb while encouraging private sector-driven, sustainable economic growth.

The foundation of U.S. military power is the size of America’s manufacturing base. Although the United States has the world’s largest economy, with GDP of $30.4 trillion as of 2025, the American manufacturing sector was only $2.9 trillion or about 9.5% of GDP. In sharp contrast, the size of China’s manufacturing sector was $4.8 trillion or about 25% of GDP of $19.5 trillion. Simply put, although the size of the U.S. economy was about 60% larger than China’s, the American manufacturing sector was only about 60% the size of China’s manufacturing sector.

IF AMERICA WON’T BUILD SAUDI ARABIA’S REACTORS, BEIJING WILL

It is unlikely that the United States will be able to close the manufacturing gap with China for the foreseeable future. 

According to the International Monetary Fund projections prepared in July 2026, the real rate of growth of the U.S. economy is expected to be 2.3% in 2026 and 2.2% in 2027. For the comparable periods, China’s real GDP growth rate is projected to be 4.6% and 4.1%. 

Assuming the US will grow at a real rate of 2.5% per annum (which is higher than the 1.8% annual real growth rate assumed by the Congressional Budget Office), then at the end of a decade, the size of the economy would be about $38.9 trillion. If the share of manufacturing increased to 15% of GDP by the end of a decade, the size of the U.S. manufacturing sector would amount to $5.8 trillion. 

Even if the Chinese economy grew at only 2.5% per annum (the same rate as the U.S. and significantly lower than IMF projections), and assuming there is no change in the share of the manufacturing sector’s share of the country’s economy, at the end of ten years the size of China’s manufacturing sector would be $6.3 trillion, which still would be larger than America’s manufacturing sector at that time.

So, the American manufacturing sector will have to shift its focus from consumer goods to military and dual-use products. Other countries within America’s sphere of influence would be key U.S. trade partners facilitating this transition, particularly for consumer goods.

Decoupling from the ecosystems of adversaries such as China and Russia is not a choice but an existential necessity. 

Manufacturing represents the end of the supply chain, but the intermediate and beginning stages are equally important for the integrity and security of the supply chain. After all, the supply chain is only as strong as its weakest link. 

Given the reality of a smaller American manufacturing base relative to China, the United States will have to have comparatively higher productivity driven by Artificial Intelligence and other technologies in order to produce more and better-quality military and dual-use goods with the same resources. 

The backbone of AI-driven productivity is the data centers ecosystem: land, water, and electric power. The United States has sufficient land and water and has the potential to significantly turbocharge its electric power-generating capacity. The key is to substantially expand the share of renewable nuclear fuel in the energy mix to support the huge demand for electric power that an AI-driven productivity revolution requires. 

The NIMBY backlash against data centers and nuclear power is a misguided, self-imposed constraint that will have to be addressed and overcome via the democratic political process, not by fiat. The national security dimensions of the AI revolution have yet to be seriously considered.

The rest of the Americas have the potential to supply the United States with key basic natural resources, critical minerals, fossil fuels, and agricultural products required to safeguard U.S. military and economic security.

Argentina, Bolivia, and Chile collectively have identified lithium reserves of about 64 million tons or about 40% of world identified reserves. Lithium is the key ingredient for rechargeable batteries that power electric vehicles – a sector dominated by China. 

Chile, Peru, and Mexico collectively have proved copper reserves of about 318 million tons or about 33% of world proved reserves. Copper is a basic building block of industry, including the electric power, transportation, communication, and construction sectors.

Venezuela has the world’s largest proved oil reserves of about 303.8 billion barrels. Canada has proved oil reserves of 170.3 billion barrels. Collectively, the two countries account for about 27% of world oil reserves.

Canada has proved potash reserves of about 1.1 billion tons or about 20% of world proved reserves. Potash is the main ingredient for fertilizers and critical for food security.

The quintet of Argentina, Brazil, Canada, Chile, and Mexico is an agricultural combine that guarantees food security within the U.S. sphere of influence and beyond. 

Of course, to regenerate the U.S. manufacturing base and unlock the potential of the other countries of the Americas to ensure robust supply chains from exploration, to development, to refining and processing will require the mobilization of a massive amount of private sector investment. 

The U.S. government cannot continue on its current trajectory to a fiscal meltdown that would destroy America’s capital markets, which have financed our nation’s economic growth. As of fiscal year-end 2025, the total federal debt of $37.6 trillion represented 124% of GDP of $30.4 trillion. According to projections prepared by the Congressional Budget Office, total federal debt held by the public will mushroom to 175% of GDP in 2056.

CHINA HAS ROCKS. WE HAVE LOBBYISTS. GUESS WHO’S WINNING THE CRITICAL MINERALS WAR?

It is within the power of Washington’s decision-makers to craft a pathway to fiscal resiliency. Instead of squandering the nation’s scarce resources to slay imaginary foreign dragons, it’s time to slay the real fiscal monster at home that is an imminent existential threat. 

We cannot betray our Founding Fathers. On our 250th anniversary, the legacy we must bequeath to future generations is a strong, secure and resilient America.

Samir Tata is the founder and president of International Political Risk Analytics, an advisory firm based in Reston, Virginia, and author of the book Reflections on Grand Strategy: The Great Powers in the Twenty-first Century.

Free Training

Source link

U.S. Manufacturing Onshoring Stocks For Investors Watching Tariff Driven Factory Spending


With Washington now applying 50% tariffs on US$20b of Canadian imports and Ottawa preparing dollar-for-dollar retaliation, the long talked about shift toward onshoring suddenly feels more real. This disruption to steel, autos, lumber, and other cross border flows could reshape where factories sit and where capital goes. This article walks through 3 stocks exposed to this news and why they may matter for your watchlist.

The three stocks below are just a starting sample, since the full screen surfaced 29 more industrials and materials companies with onshoring related narratives that are not covered here but may be worth a closer look. To identify and analyze the ideas that best fit your own approach, head straight into the U.S. Manufacturing Onshoring Beneficiaries (Industrial & Materials) screener.

MYR Group (MYRG)

Overview: MYR Group is a US based electrical contractor that builds and maintains high voltage lines, substations, and complex wiring for utilities, factories, data centers, transport systems, and other large infrastructure projects, with operations largely tied to domestic spending on power grids and industrial facilities. As manufacturers bring more production onshore and plants are upgraded, MYR Group’s role wiring those facilities and reinforcing the surrounding grid places it close to the physical work behind the onshoring trend.

Operations: MYR Group generates about US$2.1b from Transmission & Distribution projects and about US$1.9b from Commercial & Industrial work, giving it two sizeable revenue pillars across utility and industrial customers.

Market Cap: US$5.0b

MYR Group offers exposure to the nuts and bolts of onshoring, wiring up new US factories, data centers, and grid upgrades while carrying a sizeable backlog of multi year utility contracts that add visibility to future work. The company has been focusing on higher margin projects such as battery storage and data centers, which supports improving profitability. At the same time, rising labor costs, lumpy commercial and industrial backlog, and heavier spending to win bigger jobs could pressure margins if demand slows. For investors tracking supply chain reshoring, this mix of opportunity and execution risk makes MYR Group an electrical contractor worth a closer look.

MYR Group’s push into higher margin data center and battery projects could be masking a very different risk reward profile than its utility backlog suggests. Get the full picture in the 5 key rewards and 1 important warning sign

NasdaqGS:MYRG Revenue & Expenses Breakdown as at Aug 2026NasdaqGS:MYRG Revenue & Expenses Breakdown as at Aug 2026

Build your own industrial onshoring shortlist

MYR Group and the two other stocks in this article all came from a single screen, but the real value comes from shaping a process that fits you. Use our flexible Screener to mix filters like valuation, balance sheet strength, and risks, or tap into ready made themes through our Investing Ideas.

Granite Construction (GVA)

Overview: Granite Construction is a U.S. infrastructure contractor and materials producer that builds and rehabilitates roads, bridges, rail lines, airports, dams, industrial sites, and energy projects, while also supplying aggregates and asphalt that feed its own jobs and third party customers. That mix ties Granite directly to the onshoring theme as manufacturers, logistics hubs, data centers, and energy projects require more domestic transport links, industrial sites, and construction materials.

Operations: Granite generates about US$4.1b from its Construction segment and about US$1.2b from Materials, offset by around US$0.4b of intersegment eliminations where it supplies its own projects.

Market Cap: US$5.4b

Granite Construction offers exposure to U.S. onshoring from the ground up, literally pouring the roads, industrial pads, data center sites, and energy infrastructure that support more domestic production. The company is focusing on this demand with a growing backlog, materials integration that can help with cost control, and acquisitions that expand its reach in high growth regions. At the same time, Granite is working toward sustained profitability and carries meaningful debt, so execution on new projects and further deals needs to be tight. For investors tracking onshoring, this combination of infrastructure exposure, materials scale, and balance sheet risk makes Granite a stock to watch closely.

Granite Construction’s growing backlog and materials scale could be masking a very different risk reward mix than many investors assume. Get the full story in the 4 key rewards and 2 important warning signs

NYSE:GVA Revenue & Expenses Breakdown as at Aug 2026NYSE:GVA Revenue & Expenses Breakdown as at Aug 2026

EMCOR Group (EME)

Overview: EMCOR Group is a U.S. based electrical and mechanical contractor that designs, installs, and services the critical systems that keep factories, data centers, and other industrial facilities running. This ties it directly to onshoring related builds and upgrades as production shifts onshore from Canada. Alongside this manufacturing work, EMCOR also provides broad facility services such as maintenance, energy retrofits, and industrial turnaround work across sectors like healthcare and refining.

Operations: EMCOR generates most of its revenue from U.S. Mechanical Construction and Facilities Services at about US$8.2b and U.S. Electrical Construction and Facilities Services at about US$5.8b. It also sees additional contributions from U.S. Building Services at about US$3.2b and U.S. Industrial Services at about US$1.4b.

Market Cap: US$34.7b

For investors tracking U.S. manufacturing onshoring, EMCOR Group provides a mix of electrical and mechanical project work on data centers, high end factories, and industrial sites. This is supported by facility services that can add recurring earnings. Management has highlighted a large and diversified backlog linked to data centers, healthcare, and manufacturing, along with a history of using acquisitions and prefabrication to pursue higher efficiency and margins. At the same time, the company notes risks around labor shortages, industrial cycle swings, and the need to absorb tariff related cost changes, while working to build contractual protections and pricing discipline. For investors seeking exposure to onshoring driven factory work, with both quality metrics and execution risks to consider, EMCOR may warrant closer attention.

EMCOR’s mix of high-spec factory and data center work, combined with recurring services, suggests a story that many investors may only be half seeing. Get the full context in the analysis report for EMCOR Group

NYSE:EME Revenue & Expenses Breakdown as at Aug 2026NYSE:EME Revenue & Expenses Breakdown as at Aug 2026

Seeking Alternatives Before The Crowd

Fresh stock stories can move from quiet to breakout fast. Use this momentum while it matters, before they get fully caught by the crowd. Get in early.

  • Chase durable income ideas with a curated 12 dividend fortresses that aim to keep portfolios supported even when prices are jumping or dropping elsewhere.
  • Track tomorrow’s automation leaders through a targeted 37 robotics and automation stocks that focuses on businesses building the machines, sensors, and software behind rising efficiency trends.
  • Position ahead of infrastructure momentum with a focused 39 power grid technology and infrastructure stocks that highlights companies gearing equipment and services toward grid upgrades while they remain under the radar for now.

This article by Simply Wall St is general in nature. We provide commentary based on historical data
and analyst forecasts only using an unbiased methodology and our articles are not intended to be financial advice.
It does not constitute a recommendation to buy or sell any stock, and does not take account of your objectives, or your
financial situation. We aim to bring you long-term focused analysis driven by fundamental data.
Note that our analysis may not factor in the latest price-sensitive company announcements or qualitative material.
Simply Wall St has no position in any stocks mentioned.

Valuation is complex, but we’re here to simplify it.

Discover if EMCOR Group might be undervalued or overvalued with our detailed analysis, featuring fair value estimates, potential risks, dividends, insider trades, and its financial condition.

Access Free Analysis

Have feedback on this article? Concerned about the content? Get in touch with us directly. Alternatively, email editorial-team@simplywallst.com

Free Training

Source link

US Manufacturing PMI Slips to 53.2 in August, Missing Expectations | Forex News economic data


BitcoinWorld

US Manufacturing PMI Slips to 53.2 in August, Missing Expectations

The United States S&P Global Manufacturing PMI came in at 53.2 in August, below the expected 53.9 and down from the previous month’s reading, signaling a slowdown in factory activity growth. The data, released by S&P Global, indicates that while the manufacturing sector continues to expand, the pace of growth has moderated more than analysts had anticipated.

What the PMI Reading Means for the Economy

The Purchasing Managers’ Index (PMI) is a key indicator of economic health in the manufacturing sector. A reading above 50 signifies expansion, while below 50 indicates contraction. The August figure of 53.2 still points to growth, but the miss against expectations suggests that manufacturers are facing headwinds such as softer demand, supply chain disruptions, or rising input costs. This slowdown could signal broader economic cooling, which might influence Federal Reserve policy decisions in the coming months.

Market and Industry Reactions

Following the release, financial markets showed muted reaction as investors digested the data alongside other economic indicators. The manufacturing sector has been a bright spot in the U.S. economy, but the latest PMI reading adds to a mixed picture of resilience and vulnerability. Industry analysts note that while the sector remains in expansion territory, the downward trend could prompt businesses to adjust inventory and investment plans.

Why This Matters to You

For consumers, a slowdown in manufacturing can eventually lead to changes in product availability and pricing. For investors, it provides a signal about corporate earnings potential in industrial sectors. Policymakers watch PMI data closely as it helps shape decisions on interest rates and economic stimulus. Understanding these trends helps individuals and businesses make informed financial choices.

Conclusion

The August S&P Global Manufacturing PMI of 53.2, while missing expectations, still indicates expansion in the U.S. manufacturing sector. The moderation in growth, however, warrants attention as it may reflect broader economic challenges. As always, the data will be monitored for trends in the months ahead.

FAQs

Q1: What is the S&P Global Manufacturing PMI?
The S&P Global Manufacturing PMI is a monthly survey-based index that measures the economic health of the manufacturing sector. It tracks new orders, production, employment, supplier deliveries, and inventories.

Q2: Why is a PMI below expectations significant?
A PMI below expectations suggests that the manufacturing sector is growing more slowly than analysts predicted, which can signal broader economic deceleration and influence market sentiment and policy decisions.

Q3: How does the PMI affect the average consumer?
Manufacturing activity influences product availability, pricing, and employment. A slowdown could lead to fewer job opportunities in manufacturing and potential price adjustments for goods.

This post US Manufacturing PMI Slips to 53.2 in August, Missing Expectations first appeared on BitcoinWorld.

Free Training

Source link

ES Foundry backs PERC amid US PV manufacturing shift to n-type


ES Foundry CEO Alex Zhu tells PV Tech Premium that the company’s strategy is centred on delivering commercially bankable US-made cells today, even as it prepares to transition from crystalline bifacial p-type passivated emitter rear contact (PERC) to a next-generation n-type technology.

The company recently completed a 2GW expansion of its solar cell manufacturing capacity in Greenwood, South Carolina, taking its total capacity to 3GW as it seeks to establish itself as one of the few large-scale crystalline silicon cell manufacturers producing and shipping product in the US.

Es Foundry began operations with its first 1GW of capacity in 2025. According to Zhu, the company expects to have the expanded capacity fully ramped by October.

For him, however, the significance of the expansion extends beyond the headline capacity figure. He argues that ES Foundry’s differentiation lies in having moved from announcements to actual production.

“In terms of actual production, we are the largest crystalline solar cell manufacturer in the US,” Zhu tells PV Tech Premium.

He contrasts this approach with what he describes as a US solar manufacturing landscape characterised by numerous large announcements, some of which have not translated into operating capacity.

That focus on delivering product is also central to ES Foundry’s technology strategy.

Why PERC? And what comes next?

Last year, energy market analyst Clean Energy Associates (CEA) said PERC solar PV technology was “all but obsolete” in Europe, with n-type tunnel oxide passivated contact (TOPCon), heterojunction (HJT) and back contact (BC) technologies having almost entirely displaced it in “many international markets”, driven by China’s manufacturing scale, lower prices and higher efficiency.

Yet while much of the global industry has moved on, US cell manufacturer ES Foundry is taking a different approach, betting on PERC as the foundation of its domestic manufacturing strategy — for now.

Zhu acknowledges that PERC does not offer the same efficiency potential as newer cell technologies. But he argues that efficiency is only one part of the equation for a new US manufacturing operation.

“The reason we chose PERC is that it is very reliable and has a robust process window,” he notes.

For ES Foundry, that maturity provides two important advantages. The first is bankability. Financial institutions and customers are already familiar with PERC, while some newer technologies have a shorter track record in commercial manufacturing.

“The whole banking industry are familiar with PERC,” Zhu says. “Whereas some of the new technologies in US have not been fully tested.”

The second advantage is manufacturing. The US is rebuilding a solar manufacturing workforce after years in which much of the global cell production base migrated to Asia. Zhu says the shortage of experienced engineers, operators and technicians makes manufacturing a mature technology with a relatively forgiving process window particularly valuable.

“Using PERC as a starting point is very good for us to train the local labour force without cause a significant loss of efficiency or reliability.”

PERC is therefore the starting point rather than the destination. Zhu says ES Foundry will eventually move from p-type to n-type technology, but the company has not yet decided which specific n-type architecture it will adopt.

“We will move to n-type technology. However, we haven’t decided which n-type technology we will go with because this depends on multiple things like IP issues, the supply chain, and equipment availability.”

For ES Foundry, the choice of technology is also an IP decision. Recent TOPCon disputes involving First Solar, JinkoSolar, Trina Solar, Maxeon and Canadian Solar underline the litigation risks facing manufacturers adopting the technology in the US.

Section 232 creates a two-sided effect

Earlier this month, US President Donald Trump introduced a 15% tariff on imports of polysilicon and its derivatives, alongside minimum import prices, under Section 232, with the measures set to take effect on 4 December 2026.

Experts, who recently spoke with PV Tech Premium, said the Section 232 measures could support established US manufacturers and upstream investment, but raise solar costs, weaken demand and potentially deter new capacity, a tension echoed by Zhu. He says the measures on polysilicon and related upstream materials will significantly increase ES Foundry’s wafer costs.

“Our current wafer cost is, for example, from 4 cents to 7 cents imported from overseas. And after that, our cost will increase to like 15 cents plus 2 cents tariffs. That’s a significant increase in our cost. And of course, that will eventually increase our price to ship to our customers. Anytime you increase the price, a customer will not like it, and your demand will reduce,” the CEO emphasises.

Having said that, Zhu says the higher cost of imported wafers could ultimately be offset by stronger demand for domestic-content modules as the price gap with imported products narrows.

For ES Foundry, therefore, Section 232 presents a balancing act: higher input costs on one side, but potentially stronger demand for its US-made cells on the other.

Zhu says domestic-content modules can benefit from an additional 10% investment tax credit, potentially reducing the overall cost of a solar project even where the domestic-content module itself carries a higher upfront price.

“Even a domestic content module by itself is more expensive, but when you’re calculating into the whole formula, the total project cost will reduce,” he says.

Zhu also points to the rapid growth of solar projects associated with AI data centres as another source of demand.

“We see so many more project developers selling their projects to support the growth of AI data centres. At the same time, those customers also require domestic content because that will reduce the overall costs.”

The opportunity extends beyond cells. As domestic-content requirements increase, Zhu expects module manufacturers and their suppliers to look increasingly at other components, including junction boxes, EVA, ribbons and frames, to maximise the domestic contribution of their products.

The One Big Beautiful Bill Act (OBBBA) and evolving trade measures are therefore becoming important parts of the commercial landscape in which ES Foundry operates.

Building the US cell supply chain and the workforce to support it

For ES Foundry, scaling US cell manufacturing goes beyond adding capacity: the company still faces gaps in both its upstream supply chain and local workforce.

The company currently sources Chinese and non-Chinese polysilicon, with wafers produced in Southeast Asia, while US-made P-type wafers are not yet part of its supply chain.

For now, however, the company is focused on ramping its cell operations rather than pursuing backward integration into wafer manufacturing or forward integration into modules.

The workforce presents another challenge. Zhu says ES Foundry is training locally but continues to see a significant skills gap, prompting partnerships with MIT’s Initiative for New Manufacturing and a local community college in Greenwood.

“We’re doing a lot of training to train our local force, but there’s a significant gap,” he says. The training programme is intended to accelerate the development of workers capable of supporting both the current factory and future manufacturing expansion.

In the near term, ES Foundry appears confident that demand will support its existing 3GW annual nameplate capacity, with off-take agreements extending through 2028.

Zhu acknowledges that higher interest rates and interconnection delays could weigh on US solar demand, but says customers can shift delayed projects elsewhere.

“Most of our customers have multiple projects on hand, so even if some are delayed, they can easily shift to other projects.”

For ES Foundry, the immediate priority is therefore clear: establish reliable cell production while building the supply chain and workforce needed for its next phase of growth.

Free Training

Source link