

Gold Near $4,300: Durable Goods Data and Fed Rate Tightening Risks – News and Statistics


Sep 25, 2026

Gold continued to hold its ground near the $4,300-an-ounce level, though the metal may face further headwinds as U.S. manufacturing activity remains relatively firm, according to Kitco News.

The Commerce Department reported Friday that U.S. durable goods orders were essentially flat in August, after a revised gain of 0.9% in July. The result came in slightly above expectations, since economists on consensus had projected a decline of 0.3%.

Core durable goods orders, which exclude the transportation sector, increased 0.3% in August, following a 0.4% rise in July. Consensus estimates had pointed to a 0.4% gain.

Non-defense capital goods orders excluding aircraft climbed 1.6% in August, well above expectations for a 0.5% increase.

Adam Button, head of currency strategy at investingLive, commented that while the headline figure was flat, the core orders carry more weight for the underlying direction of the economy, describing the number as strong and supportive of a bullish economic view.

The gold market showed little major reaction to the data. Spot gold last traded at $4,298.70 an ounce, up 0.60% on the day.

Some analysts noted that gold could still struggle, as the latest manufacturing data gives the Federal Reserve more room to keep tightening interest rates to address the persistent inflation threat.

  1. 1. INTRODUCTION

    Making Data-Driven Decisions to Grow Your Business

    1. REPORT DESCRIPTION
    2. RESEARCH METHODOLOGY AND THE AI PLATFORM
    3. DATA-DRIVEN DECISIONS FOR YOUR BUSINESS
    4. GLOSSARY AND SPECIFIC TERMS
  2. 2. EXECUTIVE SUMMARY

    A Quick Overview of Market Performance

    1. KEY FINDINGS
    2. MARKET TRENDS This Chapter is Available Only for the Professional EditionPRO
  3. 3. MARKET OVERVIEW

    Understanding the Current State of The Market and its Prospects

    1. MARKET SIZE: HISTORICAL DATA (2012–2025) AND FORECAST (2026–2035)
    2. CONSUMPTION BY COUNTRY: HISTORICAL DATA (2012–2025) AND FORECAST (2026–2035)
    3. MARKET FORECAST TO 2035
  4. 4. MOST PROMISING PRODUCTS FOR DIVERSIFICATION

    Finding New Products to Diversify Your Business

    1. TOP PRODUCTS TO DIVERSIFY YOUR BUSINESS
    2. BEST-SELLING PRODUCTS
    3. MOST CONSUMED PRODUCTS
    4. MOST TRADED PRODUCTS
    5. MOST PROFITABLE PRODUCTS FOR EXPORT
  5. 5. MOST PROMISING SUPPLYING COUNTRIES

    Choosing the Best Countries to Establish Your Sustainable Supply Chain

    1. TOP COUNTRIES TO SOURCE YOUR PRODUCT
    2. TOP PRODUCING COUNTRIES
    3. TOP EXPORTING COUNTRIES
    4. LOW-COST EXPORTING COUNTRIES
  6. 6. MOST PROMISING OVERSEAS MARKETS

    Choosing the Best Countries to Boost Your Export

    1. TOP OVERSEAS MARKETS FOR EXPORTING YOUR PRODUCT
    2. TOP CONSUMING MARKETS
    3. UNSATURATED MARKETS
    4. TOP IMPORTING MARKETS
    5. MOST PROFITABLE MARKETS
  7. 7. PRODUCTION

    The Latest Trends and Insights into The Industry

    1. PRODUCTION VOLUME AND VALUE: HISTORICAL DATA (2012–2025) AND FORECAST (2026–2035)
    2. PRODUCTION BY COUNTRY: HISTORICAL DATA (2012–2025) AND FORECAST (2026–2035)
  8. 8. IMPORTS

    The Largest Import Supplying Countries

    1. IMPORTS: HISTORICAL DATA (2012–2025) AND FORECAST (2026–2035)
    2. IMPORTS BY COUNTRY: HISTORICAL DATA (2012–2025) AND FORECAST (2026–2035)
    3. IMPORT PRICES BY COUNTRY: HISTORICAL DATA (2012–2025) AND FORECAST (2026–2035)
  9. 9. EXPORTS

    The Largest Destinations for Exports

    1. EXPORTS: HISTORICAL DATA (2012–2025) AND FORECAST (2026–2035)
    2. EXPORTS BY COUNTRY: HISTORICAL DATA (2012–2025) AND FORECAST (2026–2035)
    3. EXPORT PRICES BY COUNTRY: HISTORICAL DATA (2012–2025) AND FORECAST (2026–2035)
  10. 10. PROFILES OF MAJOR PRODUCERS

    The Largest Producers on The Market and Their Profiles

  11. 11. COUNTRY PROFILES

    The Largest Markets And Their Profiles

    This Chapter is Available Only for the Professional Edition
    PRO

    1. 11.1

      United States

      • Market Size
      • Production
      • Imports
      • Exports
    2. 11.2

      China

      • Market Size
      • Production
      • Imports
      • Exports
    3. 11.3

      Japan

      • Market Size
      • Production
      • Imports
      • Exports
    4. 11.4

      Germany

      • Market Size
      • Production
      • Imports
      • Exports
    5. 11.5

      United Kingdom

      • Market Size
      • Production
      • Imports
      • Exports
    6. 11.6

      France

      • Market Size
      • Production
      • Imports
      • Exports
    7. 11.7

      Brazil

      • Market Size
      • Production
      • Imports
      • Exports
    8. 11.8

      Italy

      • Market Size
      • Production
      • Imports
      • Exports
    9. 11.9

      Russian Federation

      • Market Size
      • Production
      • Imports
      • Exports
    10. 11.10

      India

      • Market Size
      • Production
      • Imports
      • Exports
    11. 11.11

      Canada

      • Market Size
      • Production
      • Imports
      • Exports
    12. 11.12

      Australia

      • Market Size
      • Production
      • Imports
      • Exports
    13. 11.13

      Republic of Korea

      • Market Size
      • Production
      • Imports
      • Exports
    14. 11.14

      Spain

      • Market Size
      • Production
      • Imports
      • Exports
    15. 11.15

      Mexico

      • Market Size
      • Production
      • Imports
      • Exports
    16. 11.16

      Indonesia

      • Market Size
      • Production
      • Imports
      • Exports
    17. 11.17

      Netherlands

      • Market Size
      • Production
      • Imports
      • Exports
    18. 11.18

      Turkey

      • Market Size
      • Production
      • Imports
      • Exports
    19. 11.19

      Saudi Arabia

      • Market Size
      • Production
      • Imports
      • Exports
    20. 11.20

      Switzerland

      • Market Size
      • Production
      • Imports
      • Exports
    21. 11.21

      Sweden

      • Market Size
      • Production
      • Imports
      • Exports
    22. 11.22

      Nigeria

      • Market Size
      • Production
      • Imports
      • Exports
    23. 11.23

      Poland

      • Market Size
      • Production
      • Imports
      • Exports
    24. 11.24

      Belgium

      • Market Size
      • Production
      • Imports
      • Exports
    25. 11.25

      Argentina

      • Market Size
      • Production
      • Imports
      • Exports
    26. 11.26

      Norway

      • Market Size
      • Production
      • Imports
      • Exports
    27. 11.27

      Austria

      • Market Size
      • Production
      • Imports
      • Exports
    28. 11.28

      Thailand

      • Market Size
      • Production
      • Imports
      • Exports
    29. 11.29

      United Arab Emirates

      • Market Size
      • Production
      • Imports
      • Exports
    30. 11.30

      Colombia

      • Market Size
      • Production
      • Imports
      • Exports
    31. 11.31

      Denmark

      • Market Size
      • Production
      • Imports
      • Exports
    32. 11.32

      South Africa

      • Market Size
      • Production
      • Imports
      • Exports
    33. 11.33

      Malaysia

      • Market Size
      • Production
      • Imports
      • Exports
    34. 11.34

      Israel

      • Market Size
      • Production
      • Imports
      • Exports
    35. 11.35

      Singapore

      • Market Size
      • Production
      • Imports
      • Exports
    36. 11.36

      Egypt

      • Market Size
      • Production
      • Imports
      • Exports
    37. 11.37

      Philippines

      • Market Size
      • Production
      • Imports
      • Exports
    38. 11.38

      Finland

      • Market Size
      • Production
      • Imports
      • Exports
    39. 11.39

      Chile

      • Market Size
      • Production
      • Imports
      • Exports
    40. 11.40

      Ireland

      • Market Size
      • Production
      • Imports
      • Exports
    41. 11.41

      Pakistan

      • Market Size
      • Production
      • Imports
      • Exports
    42. 11.42

      Greece

      • Market Size
      • Production
      • Imports
      • Exports
    43. 11.43

      Portugal

      • Market Size
      • Production
      • Imports
      • Exports
    44. 11.44

      Kazakhstan

      • Market Size
      • Production
      • Imports
      • Exports
    45. 11.45

      Algeria

      • Market Size
      • Production
      • Imports
      • Exports
    46. 11.46

      Czech Republic

      • Market Size
      • Production
      • Imports
      • Exports
    47. 11.47

      Qatar

      • Market Size
      • Production
      • Imports
      • Exports
    48. 11.48

      Peru

      • Market Size
      • Production
      • Imports
      • Exports
    49. 11.49

      Romania

      • Market Size
      • Production
      • Imports
      • Exports
    50. 11.50

      Vietnam

      • Market Size
      • Production
      • Imports
      • Exports
  12. LIST OF TABLES

    1. Key Findings In 2025
    2. Market Volume, In Physical Terms: Historical Data (2012–2025) and Forecast (2026–2035)
    3. Market Value: Historical Data (2012–2025) and Forecast (2026–2035)
    4. Per Capita Consumption, by Country, 2022–2025
    5. Production, In Physical Terms, By Country: Historical Data (2012–2025) and Forecast (2026–2035)
    6. Imports, In Physical Terms, By Country: Historical Data (2012–2025) and Forecast (2026–2035)

    7. Imports, In Value Terms, By Country: Historical Data (2012–2025) and Forecast (2026–2035)

    8. Import Prices, By Country: Historical Data (2012–2025) and Forecast (2026–2035)

    9. Exports, In Physical Terms, By Country: Historical Data (2012–2025) and Forecast (2026–2035)

    10. Exports, In Value Terms, By Country: Historical Data (2012–2025) and Forecast (2026–2035)

    11. Export Prices, By Country: Historical Data (2012–2025) and Forecast (2026–2035)
  13. LIST OF FIGURES

    1. Market Volume, In Physical Terms: Historical Data (2012–2025) and Forecast (2026–2035)
    2. Market Value: Historical Data (2012–2025) and Forecast (2026–2035)

    3. Consumption, by Country, 2025
    4. Market Volume Forecast to 2035
    5. Market Value Forecast to 2035
    6. Market Size and Growth, By Product
    7. Average Per Capita Consumption, By Product
    8. Exports and Growth, By Product
    9. Export Prices and Growth, By Product
    10. Production Volume and Growth
    11. Exports and Growth
    12. Export Prices and Growth
    13. Market Size and Growth
    14. Per Capita Consumption
    15. Imports and Growth
    16. Import Prices
    17. Production, In Physical Terms: Historical Data (2012–2025) and Forecast (2026–2035)

    18. Production, In Value Terms: Historical Data (2012–2025) and Forecast (2026–2035)

    19. Production, by Country, 2025
    20. Production, In Physical Terms, by Country: Historical Data (2012–2025) and Forecast (2026–2035)

    21. Imports, In Physical Terms: Historical Data (2012–2025) and Forecast (2026–2035)
    22. Imports, In Value Terms: Historical Data (2012–2025) and Forecast (2026–2035)
    23. Imports, In Physical Terms, By Country, 2025
    24. Imports, In Physical Terms, By Country: Historical Data (2012–2025) and Forecast (2026–2035)
    25. Imports, In Value Terms, By Country: Historical Data (2012–2025) and Forecast (2026–2035)
    26. Import Prices, By Country: Historical Data (2012–2025) and Forecast (2026–2035)
    27. Exports, In Physical Terms: Historical Data (2012–2025) and Forecast (2026–2035)
    28. Exports, In Value Terms: Historical Data (2012–2025) and Forecast (2026–2035)
    29. Exports, In Physical Terms, By Country, 2025
    30. Exports, In Physical Terms, By Country: Historical Data (2012–2025) and Forecast (2026–2035)
    31. Exports, In Value Terms, By Country: Historical Data (2012–2025) and Forecast (2026–2035)
    32. Export Prices, By Country: Historical Data (2012–2025) and Forecast (2026–2035)

Free Training

Source link

U.S. Manufacturing Boosts Capex Expectations


Written by Danny Levin, Deputy Editor for IIR News Intelligence (Sugar Land, Texas)

Summary

A recent outlook survey indicates U.S. manufacturers expect an increase in capital spending over the next 12 months. Industrial Info Resources project data shows U.S. manufacturing industry construction remains robust.

U.S. Manufacturers Expect More Capex

U.S. manufacturers reported another increase in expected capital expenditures over the next 12 months, based on the latest outlook survey by the National Association of Manufacturers (NAM).

According to Industrial Info Resources data, there is $785 billion worth of capital U.S. Industrial Manufacturing Industry projects under construction, with another $278 billion that could kick off in the fourth quarter.

While not all of those fourth-quarter kickoffs will move forward as planned, IIR data show $117 billion worth of projects kicked off in fourth-quarter 2025.

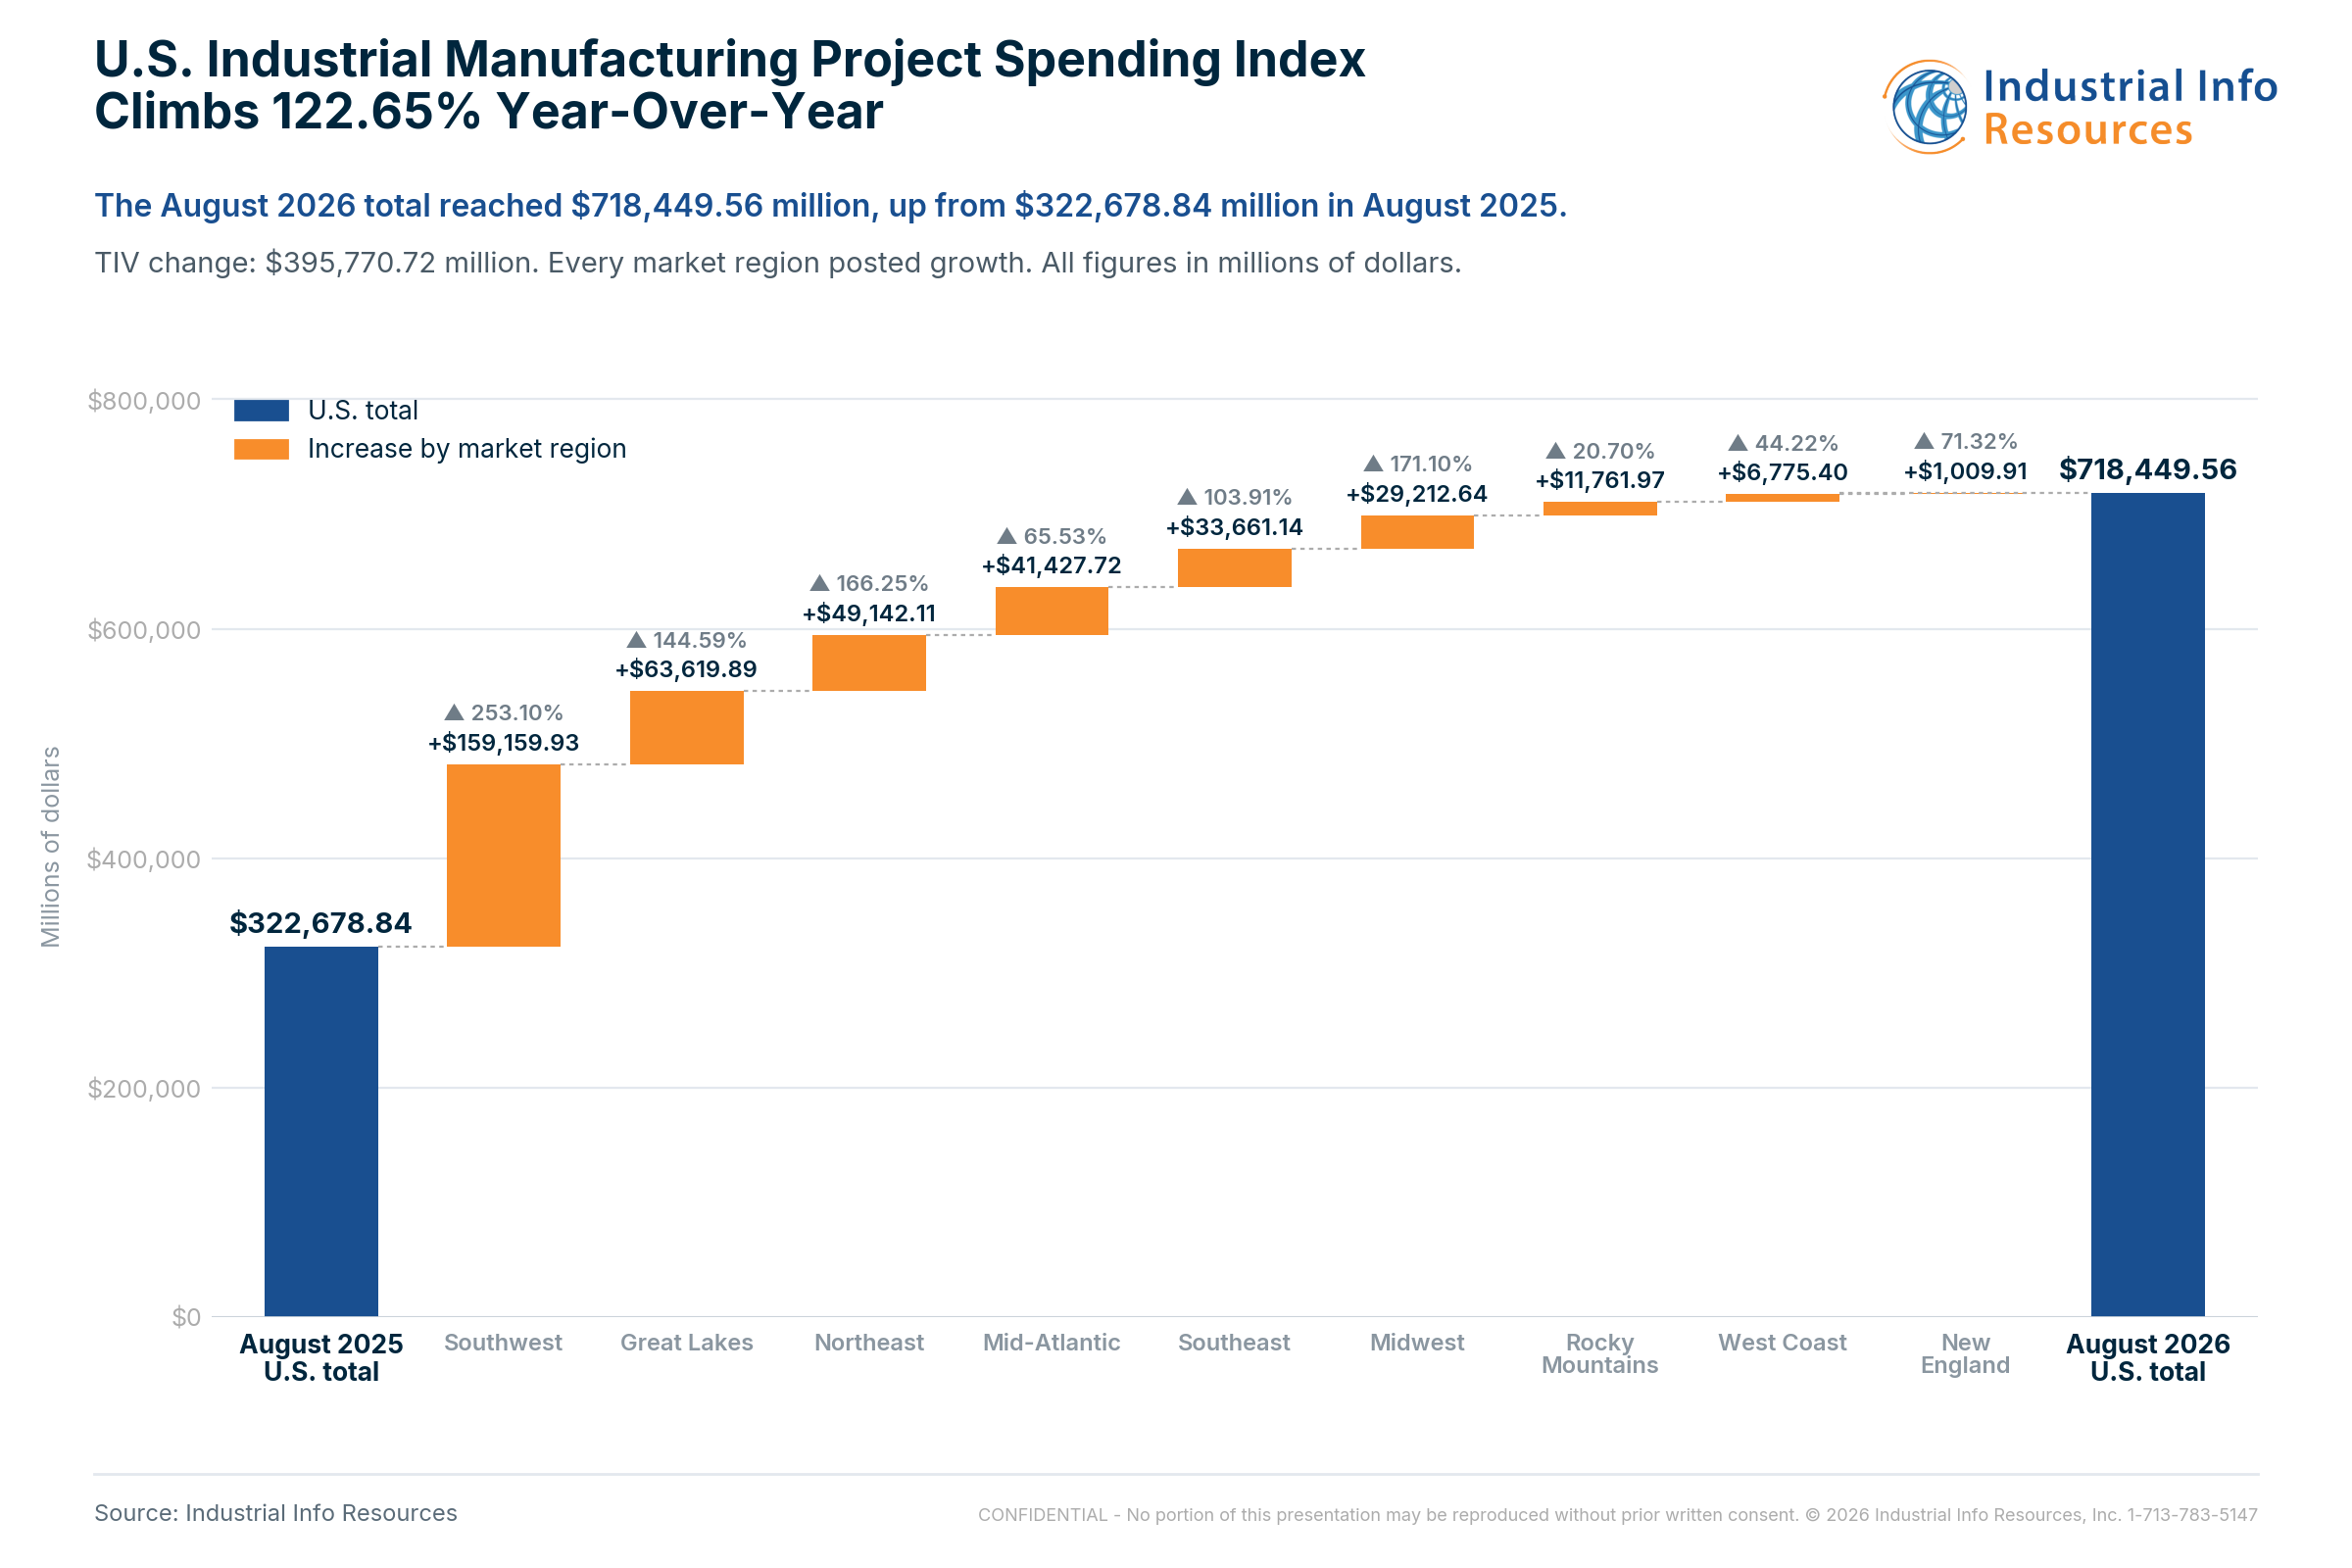
IIR’s North American Industrial Project Spending Index–which tracks both capital and maintenance project activity–for the U.S. Industrial Manufacturing industry also shows strong spending: The monthly index for August (the latest available data) shows project spending was $718.4 billion–up 122.65% from $322.7 billion in August 2025.

Attachment

The NAM survey ran from August 11 to August 27 and received 220 responses, featuring small (those with 49 or less employees), medium-sized (between 50 and 499 employees) and large manufacturers (500 or more employees).

According to the survey results, which were released September 14, respondents anticipated an increase of 2.6% in capital spending over the next 12 months–an increase from 1.8% and 1.7% in the first and second quarters, respectively.

Nearly 50% of the respondents indicated they expected additional capital spending in the next year (up from 37.1% last quarter), with 39.4% predicting no change and 11.3% forecasting reduced capital expenditures. Large firms forecast the highest level of investment, projecting a 2.9% increase over the next 12 months.

On another positive note, the overall sentiment improved to a four-year high: 78.9% of respondents were positive about their own company’s outlook, up 4.7% from the previous quarter.

…But Challenges Remain


The survey respondents reported increased raw material costs as their top business challenge, followed by rising healthcare costs and trade uncertainties (e.g. actual or proposed tariffs, trade negotiations uncertainty).

Respondents anticipate raw material prices and other input costs will rise 5% over the next 12 months, down from 5.8% that was expected in the second quarter. Overall, about 90% expect an increase in raw material costs over the next year, with nearly half anticipating increases exceeding 5%.

The Middle East conflict in particular continues to pose a challenge: “When asked how challenges, such as higher input costs, difficulty sourcing inputs and supply-chain disruptions, arising from the conflict in the Middle East compare to last quarter, nearly one-third (33.2%) said challenges have worsened. At the same time, 60.6% said that challenges were about the same as three months ago, while only 6.2% have seen their situation improve.”

In addition, respondents indicated freight rates and fuel costs are hurting supply chains.

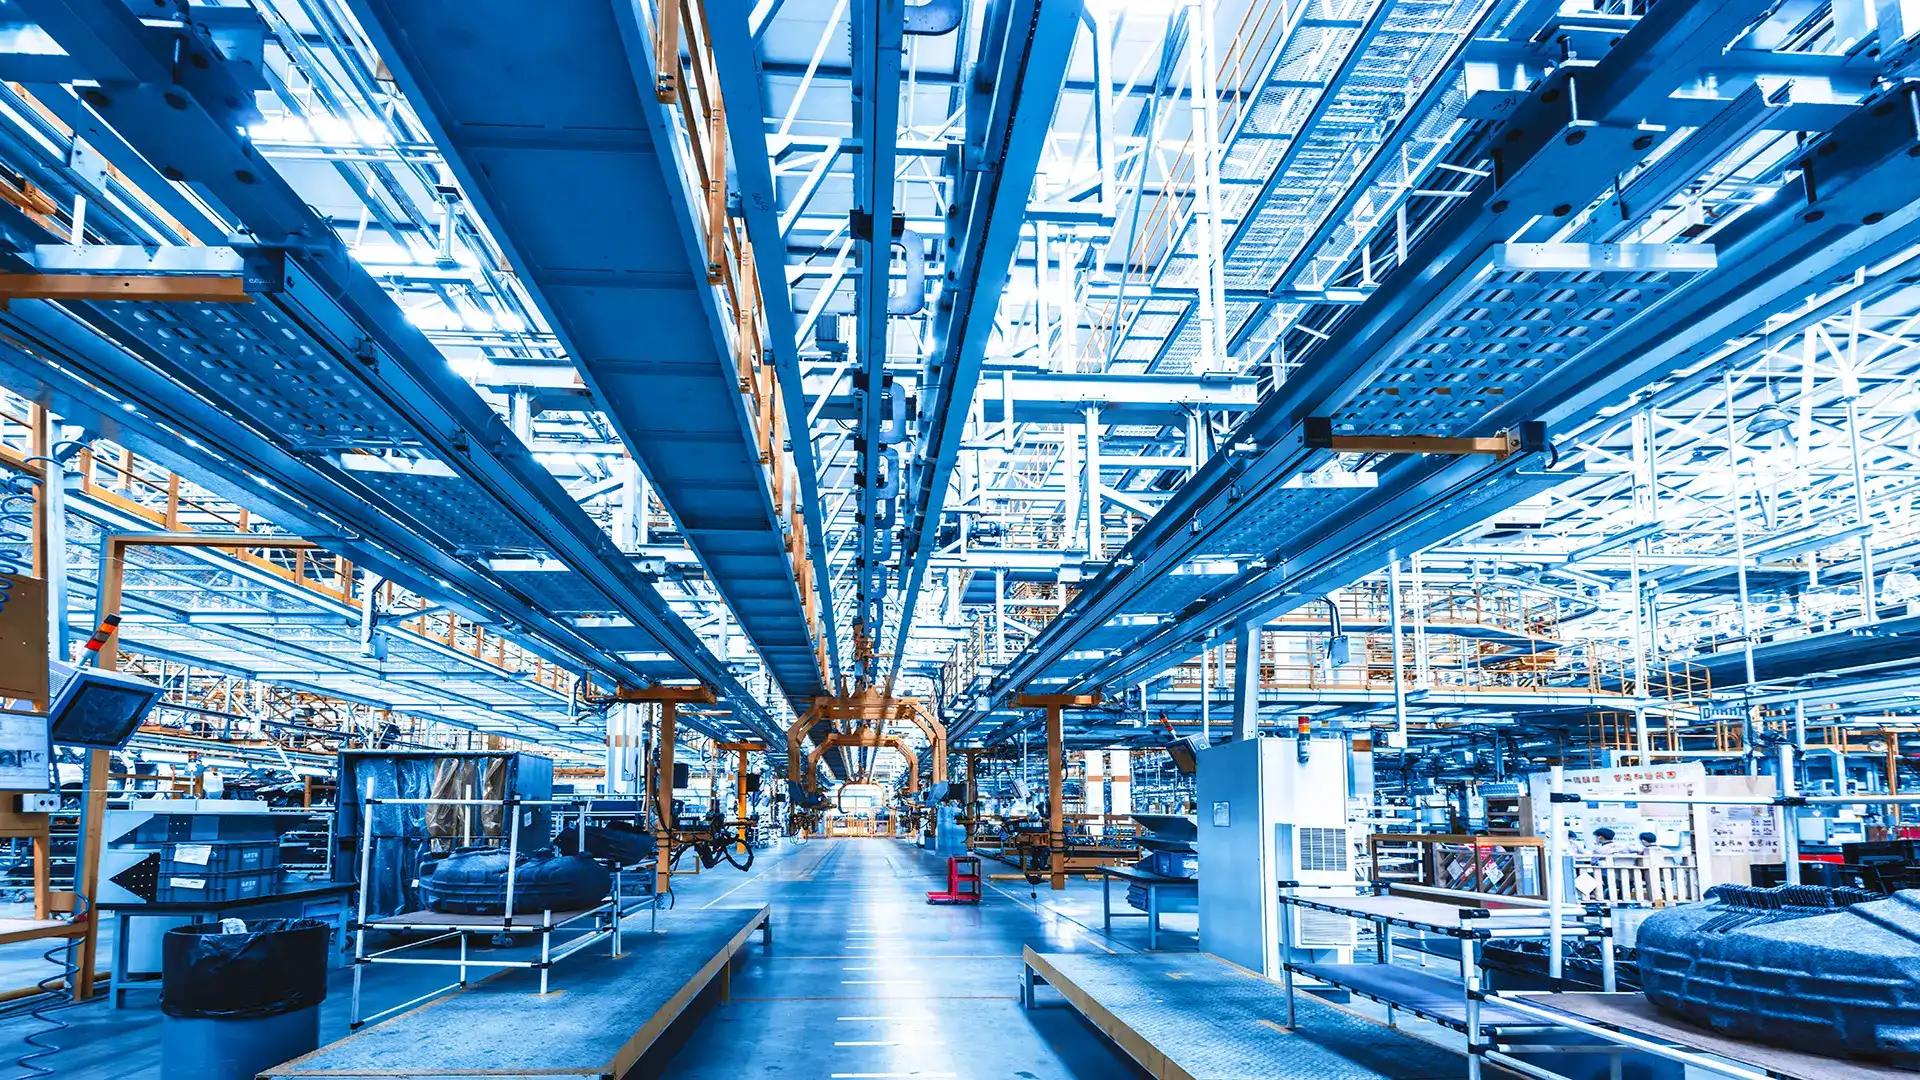
Manufacturing Construction Projects


Data centers play the dominant role in manufacturing projects being tracked by Industrial Info Resources. This includes Amazon Web Services’ ongoing construction of 14 artificial intelligence (AI) data center buildings in New Carlisle, Indiana, alongside 18 operational buildings. Upon full buildout, the overall footprint would span roughly 6.5 million square feet, require 2.25 gigawatts of grid power, and run strictly on Amazon’s proprietary Trainium2 AI chips. The GMI data show the first six buildings out of the new 14 are under construction, with eight subsequent buildings kicking off by the end of 2029.

The Industrial Info Resources Global Market Intelligence (GMI) Industrial Manufacturing Plant and Project databases offer more information–including construction schedules, investment values and necessary equipment–in a plant profile and detailed project reports.

Key Takeaways

  • According to a recent survey, U.S. manufacturers expect capital spending will increase 2.6% over the next 12 months.
  • Challenges for manufacturers stemming from the Middle East conflict have worsened.
  • $785 billion: Total investment value of U.S manufacturing projects under construction.

About Industrial Info Resources
Industrial Info Resources (IIR) is the leading provider of industrial market intelligence. Since 1983, IIR has provided comprehensive research, news and analysis on the industrial process, manufacturing and energy related industries. IIR’s Global Market Intelligence (GMI) helps companies identify and pursue trends across multiple markets with access to real, qualified and validated plant and project opportunities. Across the world, Industrial Info Resources is tracking over 250,000 current and future projects worth $30.2 trillion (USD).

Free Training

Source link

US Manufacturing Revival Fosters Derivatives Plays as High-Tech Outpaces Traditional Industry


US manufacturing is showing a revival after a long period of weak momentum, with survey data indicating stronger activity. The ISM production index has moved from sub-50 contraction territory to levels consistent with firmer growth ahead, while business surveys point to solid order books. Over the next three years, manufacturing volumes are projected to rise by 1.5–2% per year, a pace framed against the sluggish backdrop of the past two decades.

The upturn is expected to be uneven. Advanced, highly automated, high value-added industries linked to the AI and technology cycle are positioned to expand, with pharmaceuticals, tech, transport and aerospace, and electrical and power-related segments cited as areas of strength. By contrast, more traditional, labour-intensive production faces further retrenchment unless it can command a “made in America” price premium, while heavy industry such as steel sits between the two. Relative growth differentials also support the US manufacturing proposition: from 2023 to 2026, the US economy is averaging 2.5% year-on-year volume growth versus 0.9% in Europe.

Strategies for Capitalizing on the Manufacturing Divide

With the US economy outpacing Europe with a 2.5% average growth rate over the last three years, we should position our derivative portfolios to capitalize on a starkly divided manufacturing sector. We recommend buying medium-term call options on advanced manufacturing, aerospace, and semiconductor ETFs like the iShares US Aerospace & Defense ETF (ITA) or the VanEck Semiconductor ETF (SMH). This strategy leverages the massive wave of AI-driven capital expenditure and defense spending that is keeping order books full for high-tech firms.

Conversely, we must hedge this bullishness by purchasing put options on traditional, labor-intensive industrial companies that are suffering from high domestic wages. Sectors like basic textiles or low-value metal fabrication cannot absorb these wage pressures and are poised to contract further. Targeting weak components of the Russell 2000 index with put spreads will protect our portfolios as these low-margin businesses retrench.

Opportunities in Utilities and Volatility Trades

The massive power demands of AI data centers and highly automated factories mean we should also look at utilities and energy derivatives. Historically, US industrial electricity consumption has spiked alongside manufacturing construction spending, which recently hovered around an unprecedented $230 billion annualized rate. We suggest using bull call spreads on the Utilities Select Sector SPDR Fund (XLU) to capture this secular power surge.

As we watch the ISM Manufacturing Index fluctuate around the expansion-contraction threshold, we expect heightened volatility in industrial equities over the coming weeks. We should deploy long straddles on broad industrial ETFs like the Industrial Select Sector SPDR Fund (XLI) ahead of upcoming October economic releases. This allows us to profit from the sharp market reactions as the divide between high-tech champions and struggling traditional factories widens.

Start trading now — click

Free Training

Source link

Eli Lilly Advances U.S. Manufacturing Buildout


Reports related to this article:

Written by Danny Levin, Deputy Editor for IIR News Intelligence (Sugar Land, Texas)

Summary

Amid a $50 billion plan to reshore medicine production, Eli Lilly broke ground on a $6.5 billion manufacturing plant in Houston, Texas. Industrial Info Resources is tracking $57 billion worth of active and planned projects from Eli Lilly worldwide, about 90% of which is in the U.S.

New U.S. Plant Construction

Eli Lilly and Company recently broke ground on a $6.5 billion manufacturing plant in Houston, Texas, which is part of a $50 billion plan to reshore production to the U.S. Industrial Info Resources data show $57 billion worth of active and planned projects from Eli Lilly worldwide, about 90% of which is in the U.S.

The company has said the multibillion-dollar effort is designed to “meet growing demand at home and export American-made medicines to people around the world.”

This comes as major global pharma and biotech companies have been hard at work reshoring and expanding domestic production in the face of U.S. demand and potential import tariffs. However, Eli Lilly and 16 other large drugmakers are exempt from President Donald Trump’s 100% Section 232 tariff on imported patented drugs and their active pharmaceutical ingredients (APIs)–the chemical compounds in medicine–that was set to take effect on July 31.

Annette Kreuger, Industrial Info’s vice president of research for the Pharma-Biotech Industry, said: “We have definitely seen a spike in domestic capital activity. It surpasses anything experienced during the pandemic.”

“The vast majority of these projects are in the biological sector–the cash cow, if you will, for the industry,” she continued. “Tariffs and policy can change with the wind, but one thing is certain: Companies want to ensure supply of their most profitable drugs. What is good about these plants is their flexibility to change over to other products as they come to the commercial production stage.”

“Will the growth spike continue? It can’t, not at this level, and it will settle down into a more normal pattern of investment. But, make no mistake, these massive projects are making it to construction all over the country.”

Eli Lilly’s plant under construction in Houston will produce APIs that will support planned production of medicine such as Foundayo (orforglipron), Lilly’s first U.S. Food & Drug Administration-approved, once-daily oral pill for weight loss that can be taken without food or water restrictions. The plant also will support other small-molecule medicines and advanced therapeutics. Construction is expected to wrap up next year.

Lilly has said Foundayo is under regulatory review in more than 40 countries, with a full global rollout targeted for 2027. The company also is studying Foundayo for other applications, including type 2 diabetes and obstructive sleep apnea.

Industrial Info Resources offers more information on the Houston project in its Global Market Intelligence (GMI) Pharmaceutical-Biotech Plant and Project databases, where readers can find details–including construction schedules, investment values and key contacts–in a plant profile and related project reports.

GLP-1s, in particular, are a main focus for Eli Lilly and are driving billions of dollars’ worth of investment for the company, as well as the global pharma and bio industry. For more information, see August 27, 2026, article – GLP-1 Drugs Drive Pharma Construction Wave.

The project marks one of 10 U.S. manufacturing sites–and its fifth location to produce U.S.-based APIs–announced by Eli Lilly since 2020.

Eli Lilly’s Other Investment Projects


Other domestic projects underway aimed at producing APIs for GLP-1s include construction of the Lilly Lebanon API manufacturing plant in Lebanon, Indiana, which is designed for mass production of Zepbound, Mounjaro and Foundayo. The plant is part of a larger complex that also includes the $4.5 billion Lilly Medicine Foundry, which is designed for the research, trial-supply production and manufacturing process development for Zepbound and Mounjaro.

When fully operational, Lilly Lebanon API would be the largest API manufacturing site in U.S. history. Readers can view a detailed list of project reports related to Eli Lilly’s overall investment in Lebanon, which includes ongoing construction of an advanced therapies campus.

Other planned API plants are located near Richmond, Virginia, and Huntsville, Alabama.

Manufacturing sites also are planned for the production of injectable medicines and manufacturing devices, including those in Concord, North Carolina, Kenosha, Wisconsin, and Lehigh Valley, Pennsylvania.

Industrial Info Resources offers a full list of reports for active and planned Eli Lilly projects across the U.S. and worldwide.

Lilly has a major presence in Europe and plans to spend US$3 billion on an oral solid medicines manufacturing facility in Katwijk, Netherlands, which is designed to support medication such as orforglipron. Final construction permits are still under review. Readers can view more information here.

Industrial Info Resources also offers a full list of detailed reports for projects mentioned in this article, and a full list of related plant profiles.

Key Takeaways

  • $57 billion: Total investment value of active and planned projects from Eli Lilly worldwide, about 90% of which is in the U.S.
  • Production of APIs, especially for GLP-1s, is a main focus.

About Industrial Info Resources
Industrial Info Resources (IIR) is the leading provider of industrial market intelligence. Since 1983, IIR has provided comprehensive research, news and analysis on the industrial process, manufacturing and energy related industries. IIR’s Global Market Intelligence (GMI) helps companies identify and pursue trends across multiple markets with access to real, qualified and validated plant and project opportunities. Across the world, Industrial Info Resources is tracking over 250,000 current and future projects worth $30.2 trillion (USD).

Free Training

Source link

Ernst, Miller-Meeks Bill to Strengthen U…


WASHINGTON – Today, the U.S. Senate unanimously passed U.S. Senator Joni Ernst’s (R-Iowa) bipartisan Critical Infrastructure Manufacturing Feasibility Act to decrease our reliance on foreign adversaries for key materials and boost manufacturing in rural America.

The bill instructs the Secretary of Commerce to identify critical goods that are currently being imported and find ways to help domestic producers manufacture them in rural areas and industrial parks, boosting manufacturing here at home.

The bill now heads to the president’s desk to be signed into law.

2026-09-23 JKE Floor Speech on Critical Manufacturing Bill

Ernst spoke on the Senate floor ahead of its passage.

“My bipartisan bill will identify vulnerabilities in our supply chains and help bring manufacturing back to rural America, where Iowans are ready to roll up their sleeves, get to work, and once again make ‘Made in America’ the norm instead of the exception,” said Sen. Ernst. “I look forward to President Trump signing it into law.”

“Iowa has the skilled workforce, manufacturing expertise, and strong communities America needs to lead the next generation of domestic manufacturing. For too long, critical production has moved overseas, leaving American workers behind and making our country dependent on foreign supply chains,” said Rep. Miller-Meeks. “This bipartisan bill gives us a roadmap to bring that production home, create more opportunities for Iowa workers, and strengthen our nation’s economic and national security. I’m proud to have led this effort with Senator Ernst and grateful for her partnership in getting it across the finish line.”

“Supply chains are critical to global competitiveness and our national security,” said Sen. Blunt Rochester. “I’m proud to see this bipartisan legislation pass into law to help identify where we are over-reliant on foreign imports for critical infrastructure and explore how we can bring that manufacturing back to the United States. These investments will strengthen domestic production, secure our supply chains, and support good-paying jobs right here at home.”

“We have become heavily dependent upon overseas supply chains, leaving us vulnerable to increased cybersecurity risks and price fluctuations,” said Sen. Ossoff. “This bipartisan bill will take steps to mitigate those risks, while helping open the door to new manufacturing jobs in Georgia and across the nation.”

Ernst’s full remarks as delivered below:

“Mr. President, I’m here today to talk a little more about our national and economic security of the United States. This has really been the focus of my career, protecting that national and economic security.

“In 1940, the United States became the ‘Arsenal of Democracy,’ and our country came together to quickly accelerate production of the weapons, vehicles, food, and supplies that enabled the Allies to defeat the Axis powers.

“Americans in factories, farms, small businesses, and across the country did what was necessary to make what was needed.

“Instead of internalizing the lesson that our ability to make these critical items in the United States led to great success…we spent much of the last 50 years offshoring our jobs and manufacturing capabilities.

“This is something China, Russia, and other nefarious actors around the world have all been too happy to accommodate and take on themselves.

“Today, we have only ONE active facility producing cannon barrels.

“Today, we rely 100 percent on foreign sources for 12 critical minerals essential to our military and our economy.

“During COVID, we saw what happens when supply chains are strained.

“There was a global shortage of microchips, which upended manufacturers’ ability to make everything from cars to computers. At the same time, moms in the Midwest had to worry about finding baby formula due to supply chain issues at both the production and shipping levels.

“Put simply: we’ve lost the ability to make what we need right here at home.

“In the event of a conflict with one of our near-peer adversaries, supply chains will be challenged, and the United States will have to make what it needs.

“Thank goodness President Trump, his administration, and Congress have been taking steps to put us on the right track and bring back the manufacturing capabilities we need right here at home.

“My bipartisan Critical Infrastructure Manufacturing Feasibility Act builds on these efforts.

“My bill, which has already passed the Senate unanimously, directs the Secretary of Commerce to identify critical goods that are currently being imported and find ways to help domestic producers manufacture them in rural areas and shovel-ready industrial sites.

“Rural Iowans are ready to roll up their sleeves and build the factories and processing facilities we need to secure our supply chains.

“We can and need to make things here.

“But you can’t fix vulnerabilities you can’t see.

“Which is why my bill gives Congress and the Executive Branch the visibility necessary to identify gaps and close them.

“I am grateful to Representative Mariannette Miller-Meeks for introducing the House version of this bill, and for the House of Representatives passing the bill unanimously.

“Now it is time for the Senate to act and send this bill to the President’s desk. Thank you.”

###

Free Training

Source link

India Services Hits 55.8, US Manufacturing Hits 57


Market snapshot: Global economic momentum accelerated sharply in September 2026, driven by a strong rebound in India’s services activity and an impressive dual expansion in both manufacturing and services in the United States. India’s preliminary services PMI climbed to 55.8, while US S&P Global manufacturing activity recorded its fastest rate of expansion since May 2022 at 57.0.

Data Snapshot

  • The preliminary HSBC India Services PMI rebounded to 55.8 in September 2026, up from 54.1 in August 2026.
  • The US S&P Global Manufacturing PMI surged to 57.0 in September 2026, exceeding market estimates.
  • The US S&P Global Services PMI climbed to 58.7 in September 2026, compared to 56.5 in the previous month.
  • The HSBC India Composite PMI rose to 56.5 in September 2026, up from 54.3 in August, signaling a broad-based recovery.

What’s Changed

  • The Indian services activity expansion rate accelerated by 1.7 points month-on-month (derived: September flash of 55.8 vs August final of 54.1).
  • The US S&P Global Manufacturing PMI registered a sharp 3.1-point monthly increase, rising from 53.9 in August to 57.0 in September.
  • The US S&P Global Services PMI expanded by an additional 2.2 points to hit 58.7 in September compared to 56.5 in August.

Key Takeaways

  • Stronger output growth and resilient new business inflows drove the sharp recovery in India’s services sector.
  • The US economy is showing intense momentum, with manufacturing output expanding at its fastest rate since mid-2022 and jobs growth hitting multi-year highs.
  • Underlying price pressures have picked up in both the US and Indian economies, primarily fueled by rising fuel, transportation, and material costs.
  • The stronger-than-expected US data has significantly increased investor expectations of a hawkish stance or potential rate hike from the Federal Reserve in upcoming meetings.

SAHI Perspective

The synchronized surge in economic activity across India and the US highlights strong global demand but brings inflation back into sharp focus. For India, the recovery in services is a relief after August’s multi-year low. However, in the US, the dramatic expansion in both manufacturing and services to multi-year highs suggests that the economy remains highly resilient despite previous rate hikes. This resilience is likely to keep the Federal Reserve hawkish, potentially putting upward pressure on yields and creating a challenging environment for emerging market capital flows, even as domestic corporate earnings are supported by robust demand.

Market Implications

A stronger US economic footprint reinforces US Dollar strength and pushes Treasury yields higher, which historically weighs on emerging market equity and debt flows. In India, while strong domestic growth metrics are positive for corporate earnings and local equities, macro headwinds from a strengthening dollar and rising US yields could cap immediate upside. Furthermore, the pick-up in input prices across both geographies signals that inflation is not yet fully tamed, complicating the policy paths for both the Reserve Bank of India and the Federal Reserve.

Trading Signals

Market Bias: Neutral

Strong economic growth is positive for corporate earnings, but the massive beats in US PMI data (manufacturing at 57.0 and services at 58.7) lift the threat of a hawkish Fed. Yields are rising, which neutralizes the positive impact of India’s services rebound to 55.8.

Overweight: Information Technology, Capital Goods, Industrial Manufacturing

Underweight: Real Estate, Financials, Utilities

Trigger Factors:

  • US Federal Reserve monetary policy commentary and interest rate decisions.
  • Movement of the US 10-year Treasury yield and the US Dollar Index (DXY).
  • Final release of the September PMI data to confirm preliminary flash trends.
  • Crude oil price trends and their impact on imported inflation in India.

Time Horizon: Near-term (0-3 months)

Industry Context

The purchasing managers’ index (PMI) is a key leading indicator of macroeconomic health. In August, India’s services activity had slowed to a 54.1 reading—one of its lowest points in four years—as service providers faced intense competition and softer client interest. However, the September flash recovery to 55.8 points to a solid rebound in new orders and business activity. In the US, the manufacturing sector has been pulling out of a prolonged period of contraction, and the jump to 57.0 in September indicates robust inventory re-stocking and an acceleration in job creation.

Key Risks to Watch

  • Resurgent inflationary pressures driven by rising fuel, transport, and operating costs in both India and the US.
  • Hawkish Federal Reserve policy shifts, which could lead to further capital outflows from emerging markets like India.
  • Friction in global supply chains, with suppliers’ delivery times lengthening due to ongoing geopolitical uncertainties, particularly in the Middle East.

Recent Developments

In August 2026, India’s services PMI stood at a downwardly revised 54.1, while the manufacturing PMI fell to a near five-year low of 52.8. At the same time, the US manufacturing PMI had settled at 53.9 in August, reflecting moderate expansion before the sharp rebound observed in the September flash estimates.

Closing Insight

The September flash PMI numbers present a classic double-edged sword: exceptional economic expansion that confirms corporate resilience, but with the immediate drawback of sticky cost inflation and higher interest rate risks. Investors should focus on high-quality, margin-resilient sectors that can withstand higher borrowing costs while capitalizing on strong underlying demand.

High Performance Trading with SAHI.

Free Training

Source link

US Solar PV Manufacturing Capex Forecast to Hit $12.2 Billion by 2026 – News and Statistics


Sep 22, 2026

Cumulative solar photovoltaic manufacturing capital expenditure in the United States is forecast to reach $12.2 billion by the end of 2026, according to Terawatt PV Research, a figure that would represent more than half of all solar PV manufacturing spending recorded in the country since 2001. The projection appears in the firm’s new Solar Manufacturing USA Quarterly report, released on the same day as the analysis, which was carried out by the company’s founder.

The research draws on the author’s experience examining the operations of more than 500 solar PV manufacturers worldwide across a period of more than two decades, spanning the industry’s shift from research and development to commercial activity.

Report scope and methodology

The U.S.-focused report is built around the core building blocks needed to interpret quarterly metrics at individual PV manufacturing sites: effective ramped capacity, production output, technology segmentation and manufacturing capex. For the first time, coverage of PV manufacturing capex extends beyond equipment spending at the company level.

The analysis now breaks capex down quarterly for individual U.S. manufacturing sites and further divides company, site, value-chain and technology-specific spending across buildings and infrastructure, new production equipment, and maintenance and upgrades. The consolidated totals are intended to provide an accurate picture of the domestic solar PV manufacturing landscape, supporting forecasting out to 2030.

The report covers company-specific manufacturing sites in production since 2020, the period leading into the Inflation Reduction Act in 2022, the subsequent rise in manufacturing capex from 2023 onward, and bottom-up forecasting to the end of 2030 that factors in new investments arising from Section 232.

Capex trends and company concentration

U.S. solar PV manufacturing capex has exceeded $2.5 billion in each year since 2023. A record $4.14 billion was spent during 2024, with more than 60% of that total coming from just two companies: First Solar, mainly through spending on new factories in Alabama and Louisiana, and Qcells, part of Hanwha Solutions, through vertically integrated investments in Georgia.

Segmenting capex across buildings and infrastructure, new production equipment, and maintenance and upgrades highlights differing dynamics at domestic production sites. Allocations to buildings and infrastructure vary widely, from refitting an existing warehouse for module assembly to building a dedicated greenfield site for solar cell manufacturing, a difference of more than an order of magnitude on a per-installed-watt basis. Buildings and infrastructure costs accounted for about 60% of total spending during the 2023-2026 period.

Capacity, production and regional shifts

Effective capacity levels for crystalline silicon cells and modules in the United States have grown quarter on quarter since the start of 2025, with effective-capacity-conversion rates varying considerably by site, from 15-20% during early ramp-up to 70-80% at a select group of companies. Forecasting cell and module production volumes to 2030 frames the additional upstream capex needed for a more balanced silicon-based value chain in the country.

Site-level analysis allows regional trends to be identified quickly, and production data is particularly useful in assessing where materials supplies could be strategically developed. Currently, this type of analysis can only be applied to module production in the United States; doing so for ingots, wafers and cells is considered too early.

At state level, Ohio was the dominant zone for module production volumes leading into the rollout of the Inflation Reduction Act, by virtue of First Solar’s manufacturing bases. Texas has become the leader in the post-IRA era, emerging as the top state for module production in 2026 with contributions from Canadian Solar, Sirius/Elin, Imperial Star, SEG Solar, T1 Energy, TOYO/Abalance and Waaree Energies. Much of the remaining activity is in the Southeast, with a geographic split between the gulf coast corridor of Louisiana and Florida and an advanced manufacturing region covering the Carolinas, Georgia and Alabama.

Ratings and next steps

The report’s final output is to rank and rate the companies analyzed. This step is intended to focus attention on the manufacturing decisions of the top 20 companies in the U.S. solar sector, a subset that typically accounts for more than 95% of all significant investment and production.

The report is built from a proprietary bottom-up database of U.S. solar manufacturing activity analyzed at site level by quarter. Production is tracked across the crystalline silicon value chain from polysilicon through modules, alongside segmented thin-film cell and module output equivalence. Capex is divided between buildings and infrastructure, production equipment, and maintenance and upgrades, while excluding research and development contributions. The underlying data draws on audited filings and company reporting where available, supplemented by market research based on operational and industry evidence and personal communications.

Production and capex are independently subjected to statistical transformation and normalization before being combined through a weighted methodology to generate a Manufacturing Strength score for each company. An operating-production screening process prevents companies with little or no realized output from being elevated solely by announced or early-stage capital spending. The scores determine company rankings, while a standardized Z-score analysis measures each qualifying manufacturer against the wider U.S. peer group and forms the basis of AAA-to-C Manufacturing Strength ratings presented as a truncated pyramid. Ratings are displayed annually, with each quarterly report updating production and capex assumptions and therefore the forecast full-year ranking and rating.

The first Manufacturing Strength Ratings Pyramid for U.S. solar PV manufacturers is scheduled to be revealed during an opening talk at the Solar Manufacturing USA 2026 conference in Austin, Texas, on 22-23 September 2026. The Solar Manufacturing USA Quarterly report is released today, with the first quarterly deliverable scheduled for the start of October 2026, when analysis for the third quarter of 2026 is completed. Report enquiries and subscriptions are managed exclusively by pv magazine USA, extending a working partnership that led to the launch of the Solar Manufacturing USA event in 2026.

Free Training

Source link

Eli Lilly Breaks Ground On $6.5 Billion Houston Manufacturing Facility


Eli Lilly and Company has broken ground on a $6.5 billion manufacturing facility in Houston, Texas, marking another milestone in the pharmaceutical company’s $50 billion initiative to expand domestic medicine production. The facility is one of 10 U.S. manufacturing sites Lilly has announced since 2020 and will produce active pharmaceutical ingredients (APIs) for Foundayo (orforglipron), the company’s first synthetic oral GLP-1 medicine, alongside other small-molecule medicines and advanced therapeutics.

The project is expected to create more than 600 high-wage permanent jobs and approximately 4,000 construction jobs. Permanent positions will include engineers, scientists, operations personnel, and laboratory technicians. Lilly has begun recruiting employees in the Houston area as it prepares to build and operate the new manufacturing complex.

The Houston facility will be Lilly’s fifth U.S. manufacturing location dedicated to producing active pharmaceutical ingredients among the sites announced since 2020. The investment is part of the company’s broader strategy to bring pharmaceutical manufacturing back to the United States, strengthen domestic supply chains, and expand production capacity to meet growing demand for its medicines in the United States and international markets.

One of the facility’s primary products will be Foundayo (orforglipron), a once-daily oral GLP-1 receptor agonist approved in the United States for weight management in adults with obesity or adults with overweight and a weight-related condition. Unlike peptide-based GLP-1 therapies, Foundayo is a small-molecule medicine manufactured using more established production technologies that can be more readily scaled.

Foundayo is currently under regulatory review in more than 40 countries, with Lilly targeting a full global rollout in 2027. The company is also studying the medicine for additional indications, including type 2 diabetes and obstructive sleep apnea, with further clinical data expected later in 2026.

Beyond Foundayo, the Houston manufacturing site will support the production of advanced therapeutics, including oligonucleotides, a class of medicines designed to work at the genetic level by inhibiting the production of specific proteins. These therapies represent an expanding area of pharmaceutical development, with potential applications in treating diseases closer to their underlying biological causes.

The manufacturing complex will incorporate artificial intelligence, machine learning, digitally integrated systems, and advanced data analytics to improve manufacturing operations. Digital automation will be embedded throughout the facility to streamline production processes, support quality control, and help maintain a reliable supply of medicines.

Lilly is also making a substantial investment in workforce development to support the facility’s operations. The company is providing $12.5 million to support a partnership with San Jacinto College, establishing training pathways for Houston-area residents interested in advanced chemical synthesis manufacturing careers.

The partnership will expand the college’s training equipment and facilities while preparing technicians, manufacturing operators, maintenance professionals, and other skilled workers. Lilly employees will also contribute their expertise to curriculum development and instructor preparation. The training programs will provide opportunities for individuals without previous manufacturing experience to enter the biopharmaceutical industry.

Separately, Lilly is contributing $2.5 million to the San Jacinto College Foundation to provide scholarships for eligible students. Together, the workforce development partnership and scholarship contribution represent $15 million in support for education and workforce development in the Houston region.

The Houston project is part of Lilly’s broader expansion of its American manufacturing network. Of the 10 U.S. manufacturing locations announced since 2020, five will produce active pharmaceutical ingredients. These include facilities in Richmond, Virginia; Huntsville, Alabama; Houston, Texas; and two locations in Lebanon, Indiana.

The company’s other announced projects include four facilities dedicated to injectable medicines and manufacturing devices in North Carolina, Wisconsin, and Pennsylvania, along with an advanced therapies facility in Lebanon, Indiana, focused on genetic medicines.

The expansion is intended to establish additional domestic manufacturing capacity for Lilly’s growing portfolio of medicines while supporting the development of next-generation therapies. The Houston investment will also strengthen the region’s pharmaceutical manufacturing workforce through its collaboration with San Jacinto College and create new opportunities for skilled workers throughout the greater Houston area.

KEY QUOTES:

“We are thrilled to break ground on our latest ‘medicines made in America’ site in the great state of Texas. This $6.5B investment will help change the game for tens of millions of people suffering from overweight, obesity and its consequences like diabetes. We will make and ship Lilly’s latest products from Texas to people here at home and around the world.”

David A. Ricks, Chair and CEO of Eli Lilly and Company

“When you invest in a place like Houston, you invest in its people first. This facility will run on the talent of this community, powered by our relationship with San Jacinto College. We’re hiring across the greater Houston area to help residents build careers close to home. The facility itself is being built to the highest standards for safety, quality and responsible stewardship of the environment, and every one of these jobs helps bring innovative medicines to the patients counting on them.”

Edgardo Hernandez, Executive Vice President and President of Lilly Manufacturing Operations

“Eli Lilly’s manufacturing investment in Generation Park is a tremendous opportunity for the Houston region. San Jacinto College is proud to work with Lilly to develop the skilled workforce needed to support the growth of biopharmaceutical manufacturing. Together, we will expand industry-informed education and hands-on training pathways that prepare students and incumbent workers with the technical skills these advanced manufacturing careers require. This relationship will build a strong, sustainable talent pipeline for Lilly while creating meaningful, high-demand career opportunities across our region.”

Dr. Brenda Hellyer, Chancellor of San Jacinto College

Thank you for visiting Pulse 2.0. We work hard every day to bring leaders and decision makers like you the latest intelligence on business, finance, capital markets, deal flow, law, tech, and AI. Click here to subscribe to the Pulse 2.0 Newsletter.

Free Training

Source link

Planet Opens State-of-the-Art Satellite Manufacturing in Berlin


BERLIN–(BUSINESS WIRE)–Sep 22, 2026–

Planet LabsGmbH, a leading provider of daily data and insights about change on Earth, today welcomed Katherina Reiche, Federal Minister for Economic Affairs and Energy for Germany, to open its state-of-the-art satellite manufacturing facility in Berlin. Having been announced less than a year ago, Planet has achieved facility handover and cleanroom fit-out and is scheduled to commence production of its 300 kg class, 30-cm resolution class Pelican™ satellites this autumn. The first satellite is scheduled to be complete before the end of the year, and the facility will be able to scale to up to 60 satellites per year. The facility further establishes Berlin as a major European hub for advanced aerospace manufacturing and production, accelerating high-tech job growth and Europe’s sovereign Earth observation capabilities.

This press release features multimedia. View the full release here: https://www.businesswire.com/news/home/20260922048020/en/

Pelican image over Planet’s new facility in Berlin on August 10, 2026. © 2026 Planet Labs PBC. All Rights Reserved.

The new location in Berlin’s Mitte district brings increased capacity for satellites to Europe. Planet provides sovereign satellites services for countries and, moreover, can launch them fast. For example, Planet was awarded a German-funded contract to deliver dedicated satellite capacity in support of European peace and security within 2 months of contract signature, and with Sweden similarly its first sovereign satellite within 4 months, accelerating their programme 4 years. With these added manufacturing capabilities, Planet intends to not just deliver for Europe, but from Europe.

“Today I’m thrilled to give a first look at Planet’s world-class manufacturing center and the future of Planet in Berlin, Germany, and Europe,” said Will Marshall, Co-Founder and CEO of Planet. “Planet has built and successfully launched 688 satellites in 15 years, second in the world in total satellites – and we’re bringing that manufacturing prowess here. This will enable Europe to quickly gain the capacity to build scaled earth observation satellite fleets to advance Europe’s critical goals from sustainability to security – to give Europe its own eyes on threats.”

“Europe needs its own eyes in space. In an age of strategic rivalry and growing uncertainty, satellite intelligence is no longer a luxury—it is a prerequisite for security, resilience and genuine strategic autonomy. Germany has the scientific depth, industrial strength and dynamic space ecosystem to become a European anchor for this capability. Planet’s investment in Berlin is more than a vote of confidence in the city: it helps turn Europe’s ambition for sovereign access to space-based intelligence into operational reality,” said Katherina Reiche, Federal Minister for Economic Affairs and Energy.

“When Planet makes a commitment, we deliver on it,” said Martin Polak, Managing Director of Planet Labs Germany. “Less than one year after announcing our vision for a satellite facility in Berlin, we will soon begin production. Europe needs rapid, independent access to sovereign space capabilities to navigate an increasingly complex security and economic landscape. On behalf of Planet in Germany, I could not be more excited and honored to be making this investment and commitment here in Berlin, continuing Planet’s long history of partnership and innovation in Europe.”

The 5,700-square-meter facility will serve as a cornerstone of Planet’s contributions to European technological advancement in space, addressing the region’s growing demand for localized, resilient aerospace innovation and defense solutions. Berlin has been Planet’s base in Europe for over 10 years, serving as a major technical hub with a mission operations center coordinating Planet’s global fleet of hundreds of satellites, software development, imagery processing, and quality control. In addition to satellite production, Planet’s new facility will house other corporate functions such as mission operations, IT, legal, marketing, HR, and sales, among others. Satellites will be built, tested, and shipped from one location, reducing the path from parts to orbit.

Planet will grow the team significantly, adding 70 employees to its existing team of nearly 150 in Berlin.

The first Berlin-built Pelican satellites completed this year are scheduled to be launched on an Isar Aerospace Spectrum launch vehicle in early 2027 – enabling a new first for Germany. This new facility further grows Planet’s European footprint and strengthens the company’s ties with its longstanding German customers and partners, including the German Federal Agency for Cartography and Geodesy (BKG).

Planet maintains a strong and growing presence in Europe, home to over 30% of its global workforce with offices in Berlin, Haarlem, Ljubljana, Graz and London. Berlin serves as Planet’s primary base of operations in Europe. Planet’s ground station network across Germany, the UK, Norway, and Iceland downlinks nearly 50% of all satellite data globally. Planet is guided by its European AdvisoryBoard, which helps the company meet the needs of its growing European customer base.

About Planet

Planet Labs Germany GmbH is part of the Planet group and is based at Planet’s European headquarters in Berlin. Planet Labs PBC (NYSE: PL) is the parent company of the Planet group with global headquarters in San Francisco, USA. Planet is a leading provider of global, daily satellite imagery, and geospatial solutions. Planet is driven by a mission to image the world every day, and make change visible, accessible and actionable. Founded in 2010 by three NASA scientists, Planet designs, builds, and operates the largest Earth observation fleet of imaging satellites. Planet provides mission-critical data, advanced insights, and software solutions to customers comprising the world’s leading agriculture, forestry, intelligence, education and finance companies and government agencies, enabling users to simply and effectively derive unique value from satellite imagery. Planet Labs PBC is a public benefit corporation listed on the New York Stock Exchange as PL. To learn more visit www.planet.com and follow us on X, LinkedIn, or tune in to HBO’s ‘ Wild Wild Space ’.

Forward-looking Statements

Certain statements contained in this press release are “forward-looking statements” about Planet within the meaning of the securities laws, including statements about Planet’s strategic partnerships and Planet’s future growth in new and existing markets. Such statements, which are not of historical fact, involve estimates, assumptions, judgments and uncertainties. There are a number of factors that could cause actual results or outcomes to differ materially from those addressed in the forward-looking statements. Such factors are detailed in Planet’s filings with the Securities and Exchange Commission. Planet does not undertake an obligation to update its forward-looking statements to reflect future events, except as required by applicable law.

View source version on businesswire.com:https://www.businesswire.com/news/home/20260922048020/en/

CONTACT: Planet Press

Rachel Cassells

press@planet.comPlanet Investor Relations

Cleo Palmer-Poroner

ir@planet.com

KEYWORD: SWITZERLAND UNITED STATES AUSTRIA NORTH AMERICA EUROPE GERMANY CALIFORNIA

INDUSTRY KEYWORD: DATA MANAGEMENT TECHNOLOGY SATELLITE AEROSPACE MANUFACTURING SOFTWARE

SOURCE: Planet

Copyright Business Wire 2026.

PUB: 09/22/2026 05:00 AM/DISC: 09/22/2026 05:02 AM

http://www.businesswire.com/news/home/20260922048020/en

Free Training

Source link

SK Hynix And Intel Explore US Memory Chip Manufacturing Deal


SK Hynix is reportedly exploring a deal with Intel that could bring memory-chip manufacturing to the United States for the first time. Reuters, citing three people familiar with the discussions, said the companies have discussed several structures, including SK Hynix leasing part of Intel’s Ohio semiconductor site or creating a venture with Intel and major cloud companies.

But this is not a signed deal. In its official clarification on 16 September, SK Hynix said it is reviewing ways to strengthen its global competitiveness while stressing that no specific arrangement with Intel and no US memory-production plan has been finalised.

SK Hynix Could Use Intel’s Ohio Megasite

The most direct option would put SK Hynix inside Intel’s long-delayed Ohio project. Reuters reported that the Korean memory company could lease part of the site, giving it manufacturing space without building an entirely separate US wafer fab from scratch.

A second possibility is more ambitious. SK Hynix, Intel and large cloud providers could form a joint venture, potentially giving customers that consume huge amounts of AI hardware a more direct route to securing memory supply.

The exact product is still unknown. SK Hynix makes DRAM, NAND flash and high-bandwidth memory, or HBM, but Reuters said it could not determine which memory technology would be produced in Ohio.

AI Has Turned Memory Into Strategic Infrastructure

That uncertainty matters because not all memory is equally important to the current AI boom. HBM sits close to accelerators such as Nvidia GPUs and feeds them data at extremely high speed, while conventional DRAM supplies working memory across servers, PCs and other systems.

The broader AI memory chip supercycle has made those components a central constraint in data-centre expansion. SK Hynix has also deepened its relationship with Nvidia through the wider SK Group AI infrastructure push.

AI Has Turned Memory Into Strategic Infrastructure AI Has Turned Memory Into Strategic Infrastructure

We think that is the bigger story here. AI infrastructure is no longer only about who can design the fastest processor. Companies increasingly care about securing enough memory, packaging capacity and manufacturing space to keep those processors running.

Intel Could Gain A Major Customer For Ohio

For Intel, a deal could give its Ohio project a powerful outside customer at a useful moment. Intel says it plans to invest more than $28 billion in two leading-edge fabs at the site, but it slowed the timetable in 2025.

Under Intel’s latest published Ohio construction timetable, the first module is expected to begin operations between 2030 and 2031. The second is currently scheduled to start operating in 2032.

That means any SK Hynix arrangement would still be a long-term manufacturing move rather than a quick fix for today’s memory shortages.

The two companies also know each other well. In 2020, Intel agreed to sell its NAND memory and storage business to SK Hynix for $9 billion.

SK Hynix Already Has A US AI Memory Footprint

SK Hynix is not starting from zero in the United States. In August, the company broke ground on its Indiana AI-memory facility, which will package and test next-generation HBM and is expected to begin supplying US customers in the second half of 2029.

SK Hynix Already Has A US AI Memory FootprintSK Hynix Already Has A US AI Memory Footprint

That distinction is important. Advanced packaging combines and stacks chips after core semiconductor dies have been manufactured. An Ohio agreement involving memory-chip fabrication could therefore move more of the production process onto US soil.

It also fits a wider reshaping of semiconductor geography. TSMC’s expanding US chip investment shows how more of the critical AI supply chain is being pushed toward American manufacturing.

South Korea Could Still Complicate The Deal

The biggest obstacle may come from Seoul. Reuters reported that South Korea’s trade ministry considers company investment decisions a matter for SK Hynix, but any transfer involving a “national core technology” could trigger a government review under the country’s Industrial Technology Protection Act.

That could become especially sensitive if the project involves advanced DRAM or HBM technology. SK Hynix has therefore kept its language cautious and says no decision has been made.

For South African readers, the near-term effect would be indirect. Local cloud providers, enterprises and AI developers buy into a global hardware market, so tighter or more diversified memory supply could eventually influence server availability and cloud infrastructure costs.

But with Intel’s Ohio production still years away, this is more about where the next wave of AI hardware gets built than about immediate price relief.

If the talks become a real deal, the most important detail to watch will be simple: what kind of memory does SK Hynix actually plan to manufacture in Ohio?

FAQs

Is SK Hynix Building A Memory Chip Factory With Intel?

Not yet. The companies are reportedly discussing several possible structures, but SK Hynix says no agreement has been finalised. One scenario could involve leasing part of Intel’s Ohio facility, while another could involve a joint venture.

What Kind Of Memory Chips Could SK Hynix Make In Ohio?

That has not been confirmed. SK Hynix produces DRAM, NAND and HBM, but Reuters said the specific technology involved in the talks remains unknown. Advanced HBM or DRAM production would be particularly significant because those technologies are strategically important to AI infrastructure.

Does SK Hynix Already Manufacture AI Memory In The US?

SK Hynix has begun building an AI-memory packaging and testing facility in Indiana. The company says it plans to supply next-generation HBM from the site starting in the second half of 2029. A separate Ohio manufacturing deal with Intel could expand its US footprint further if the talks lead to an agreement.

Temaz Tra is an AI and technology news writer focused on the fast-moving tools, platforms, and companies shaping the digital world. He covers artificial intelligence, consumer tech, cybersecurity, software, social media, and the wider impact of emerging technologies on work, business, and everyday life. With a focus on clear reporting and accessible analysis, Temaz helps readers understand complex tech developments without the jargon. His work connects breaking news with practical context, making it easier to follow how AI and digital innovation are changing the way people live, work, and interact online.

Visit Profile Temaz TraTemaz Tra

Free Training

Source link